Plots of the Covid 2019 unfolding in Italy
I display the evolution of the number of cases per region and province. The plots are ordered alphabetically, by region.
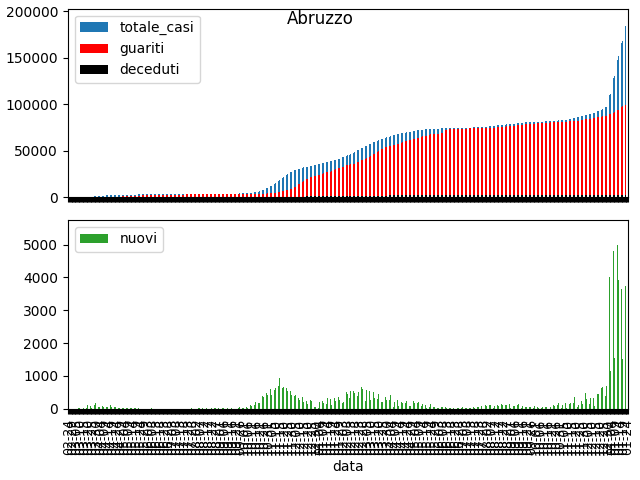
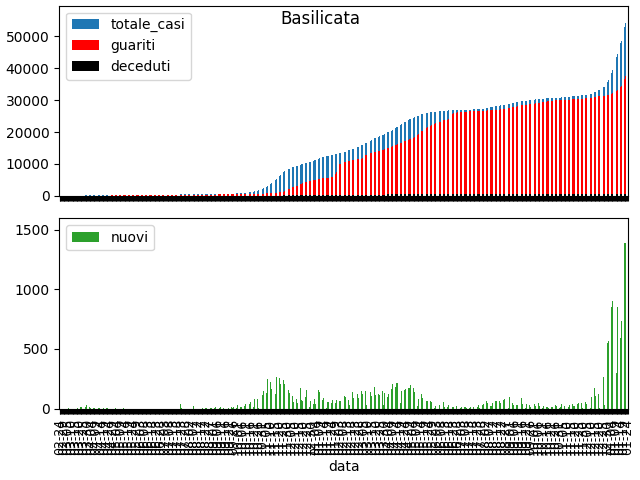
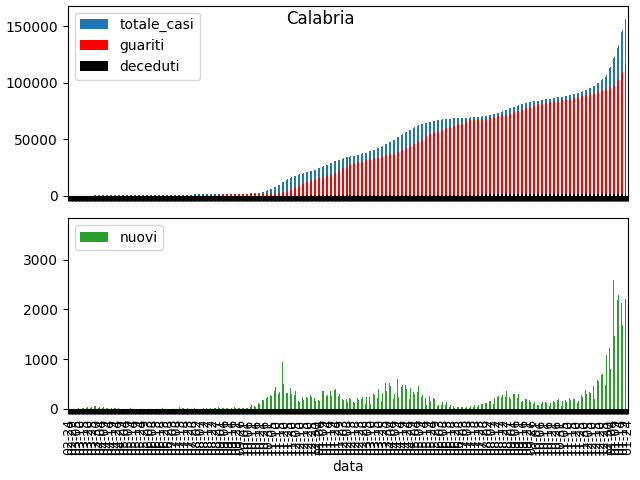
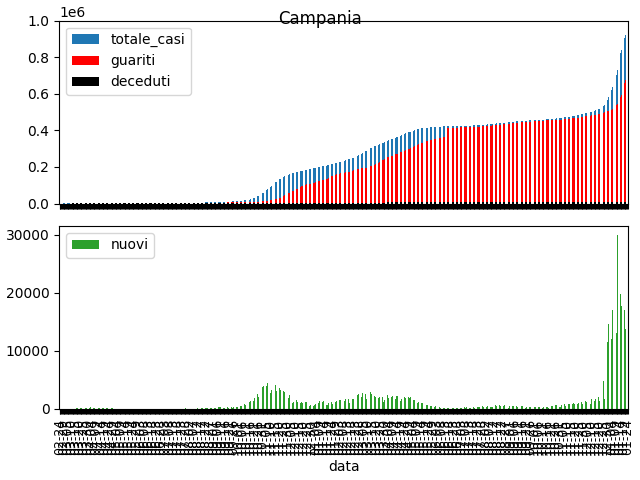
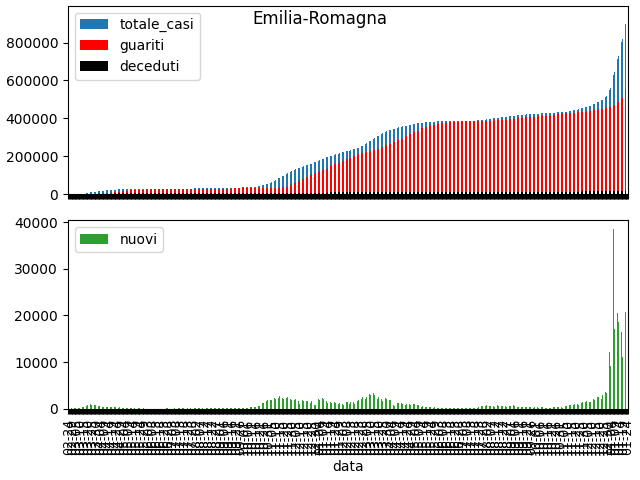
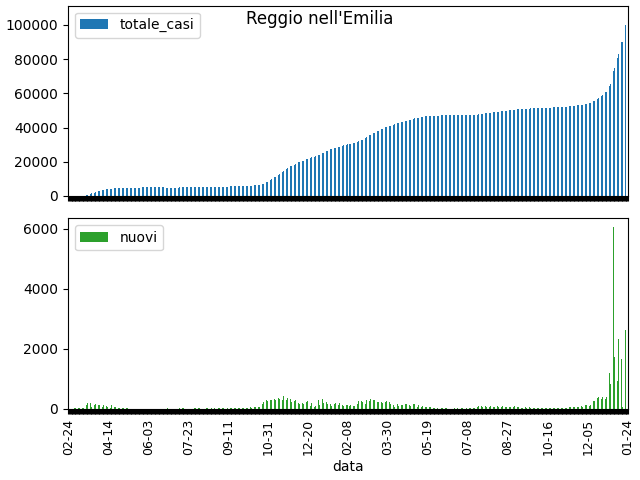
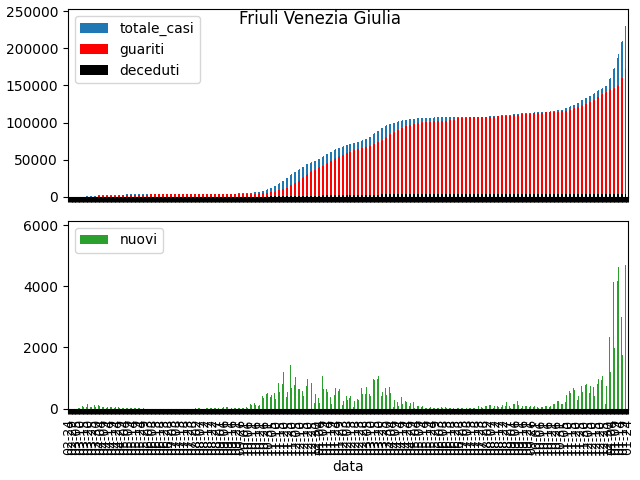
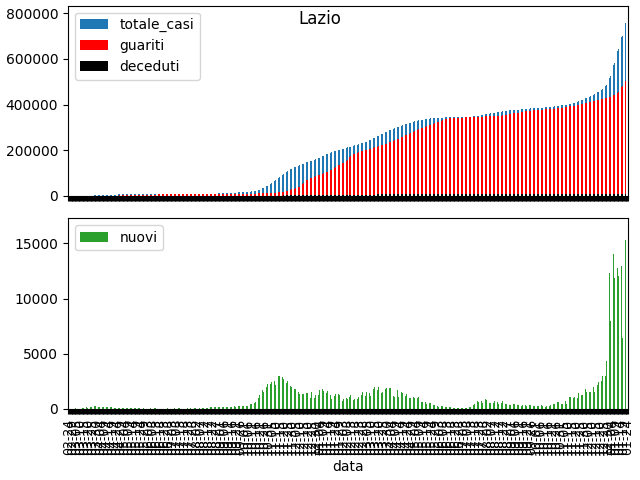
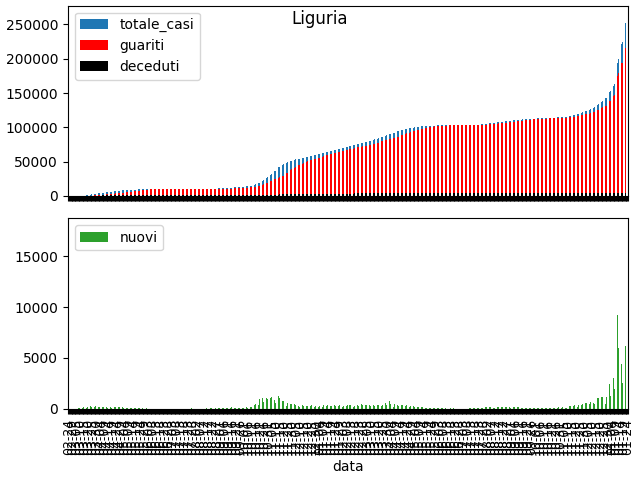
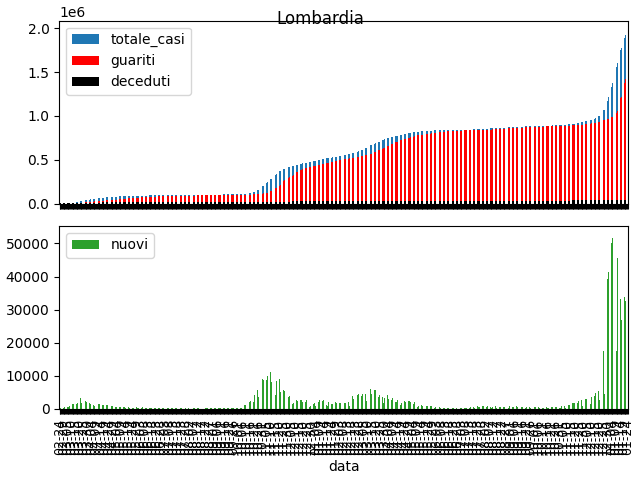
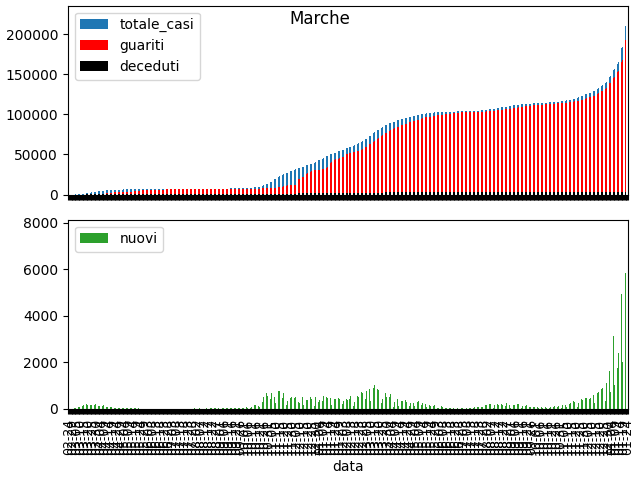
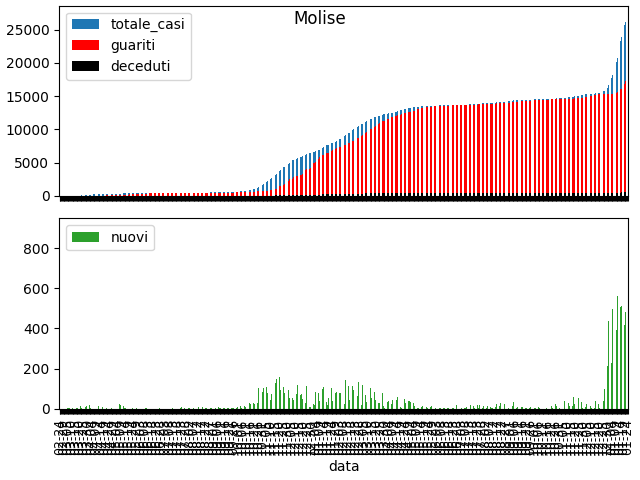
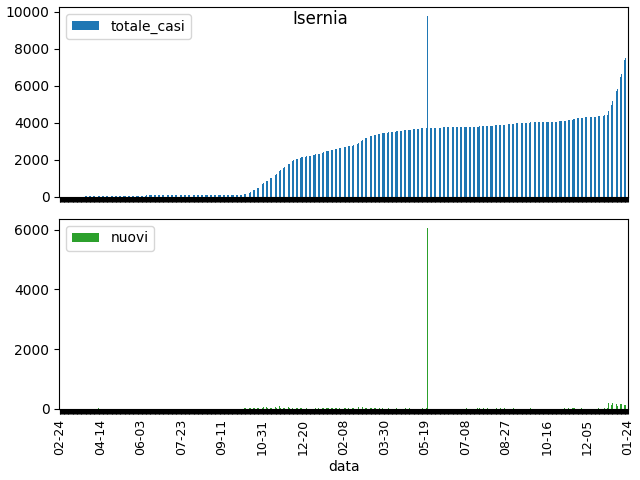
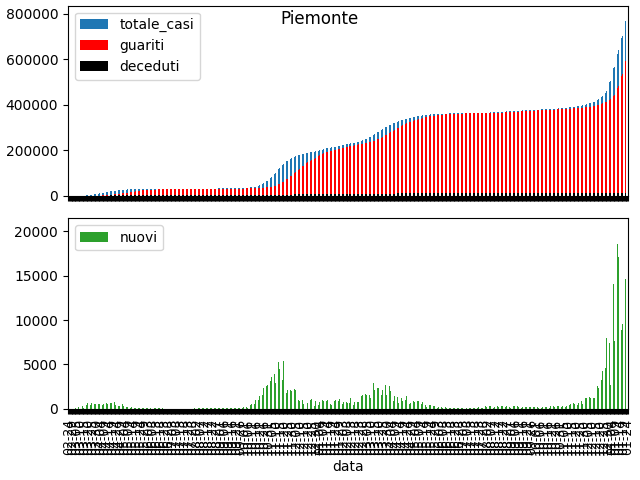
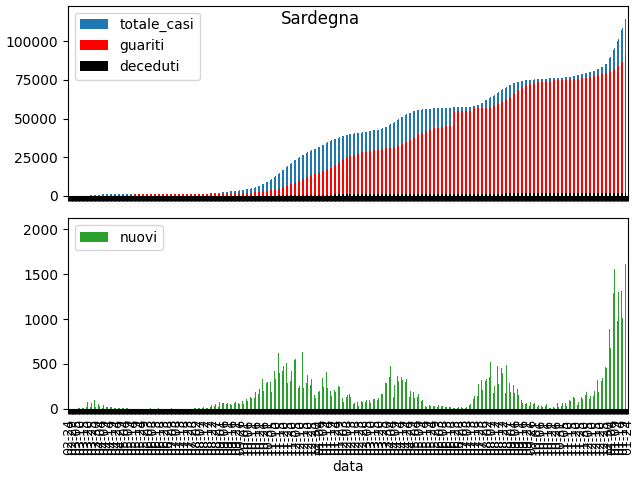
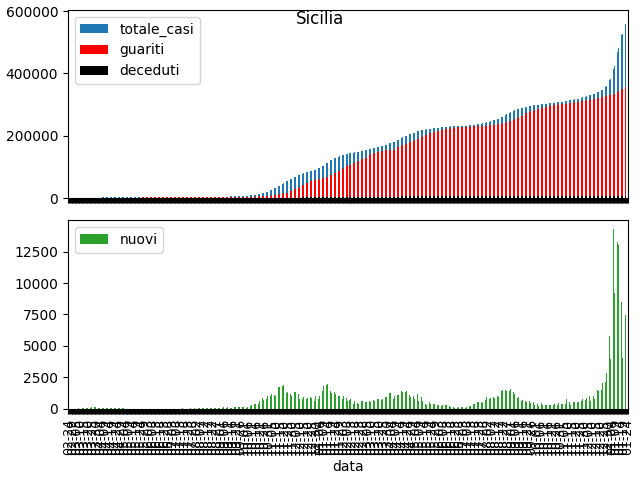
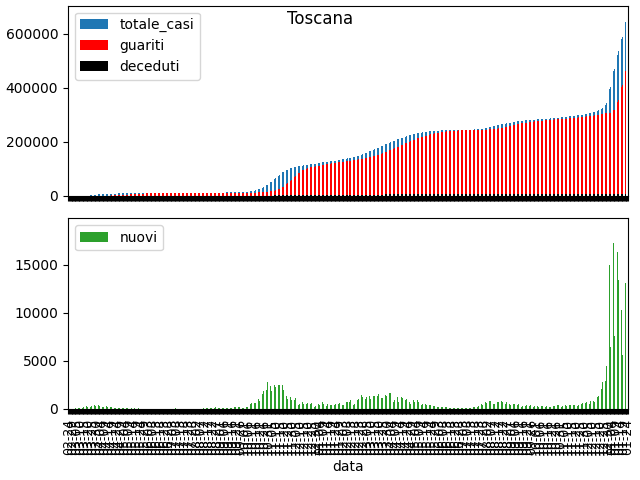
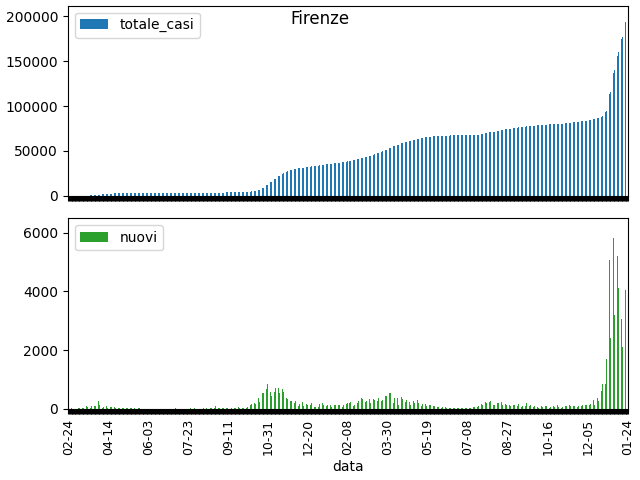
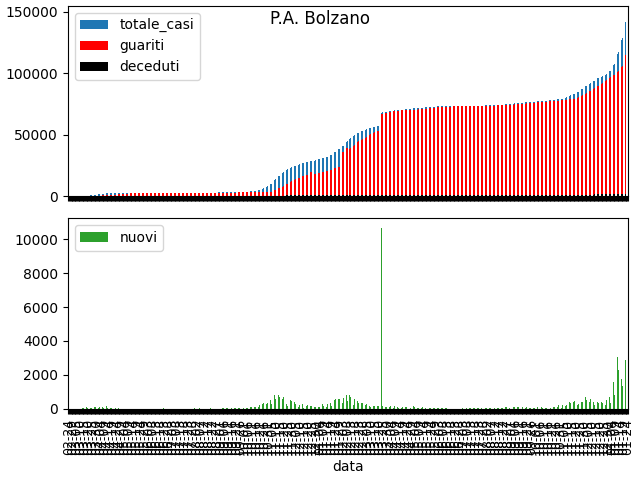
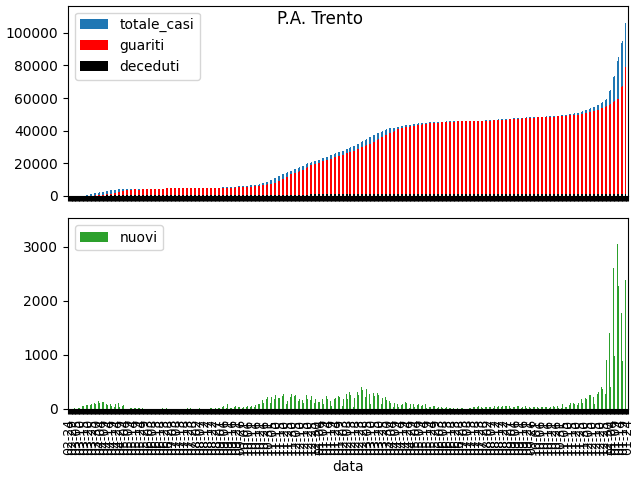
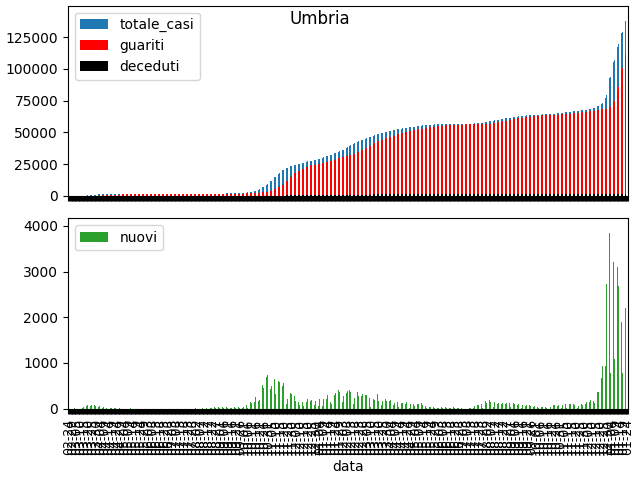
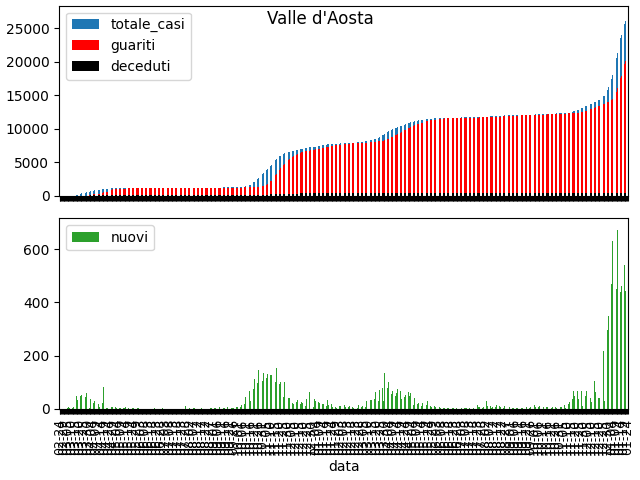
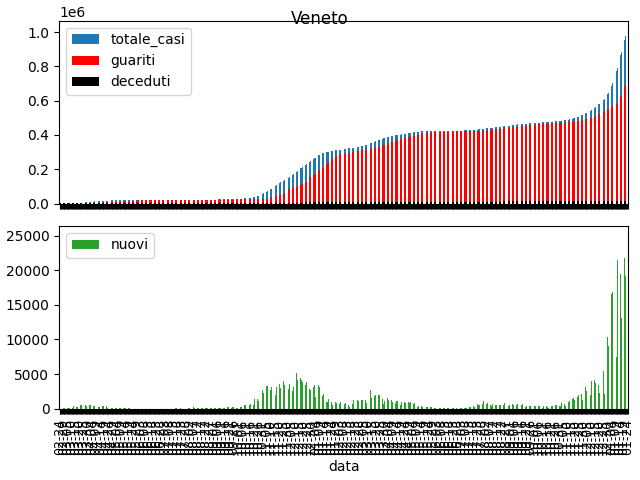
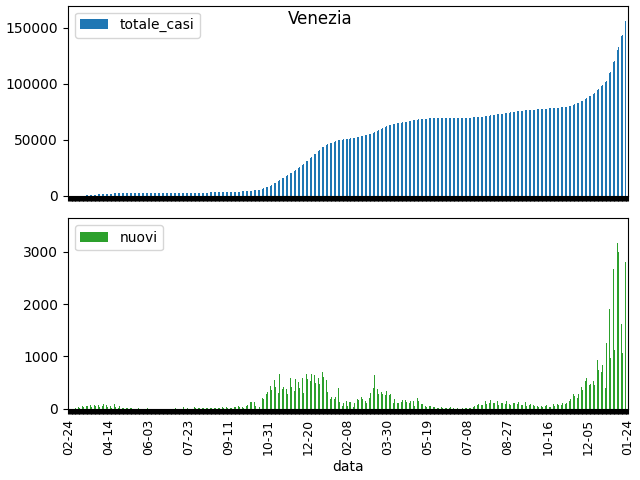
A region name is displayed in bold (e.g., Abruzzo ). A region plot includes the number of new cases per day at the bottom and on top three accumulated values: total accumulated cases (blue), total accumulated discharged cases (red), and total accumulated deceased (black).
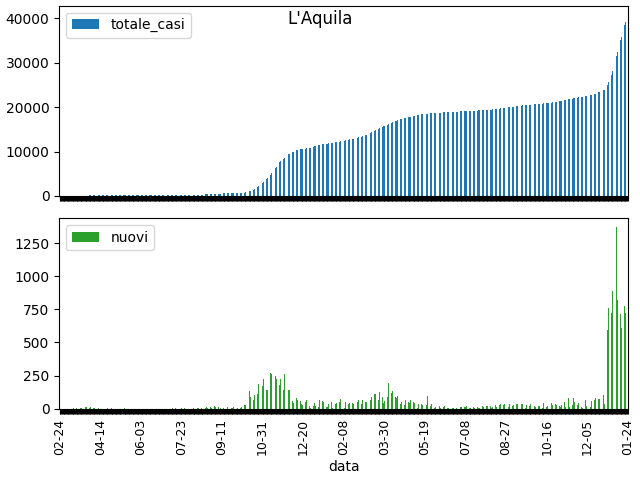
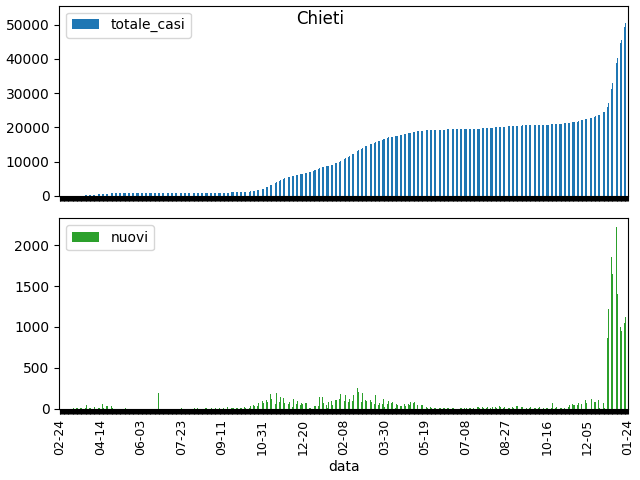
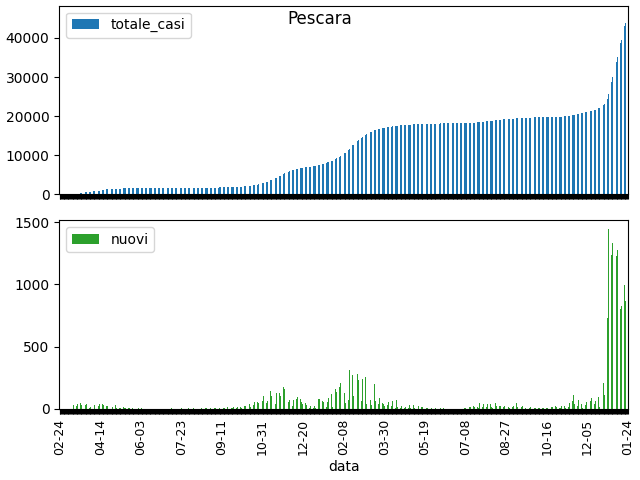
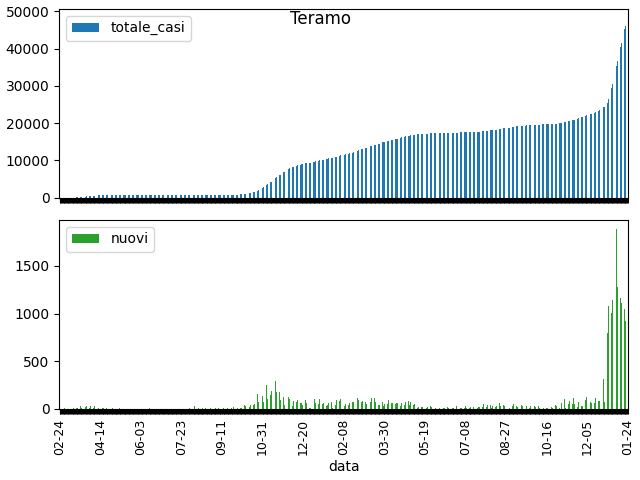
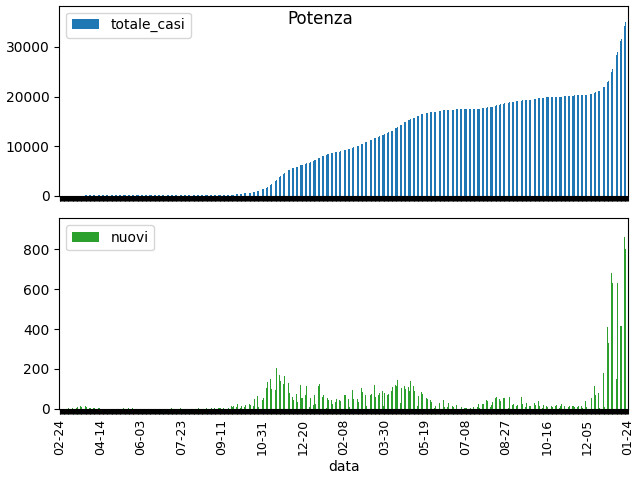
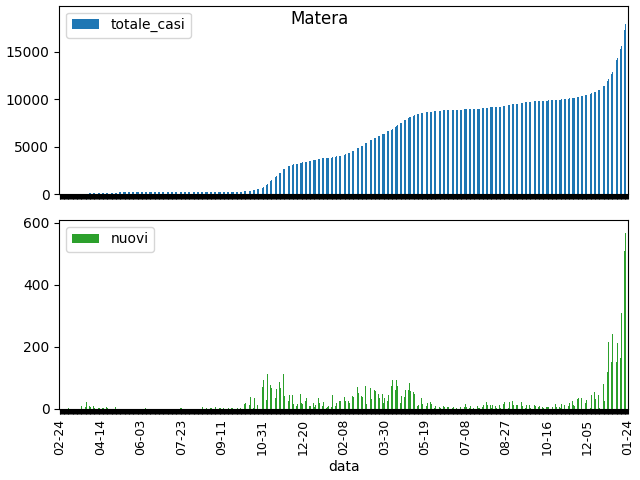
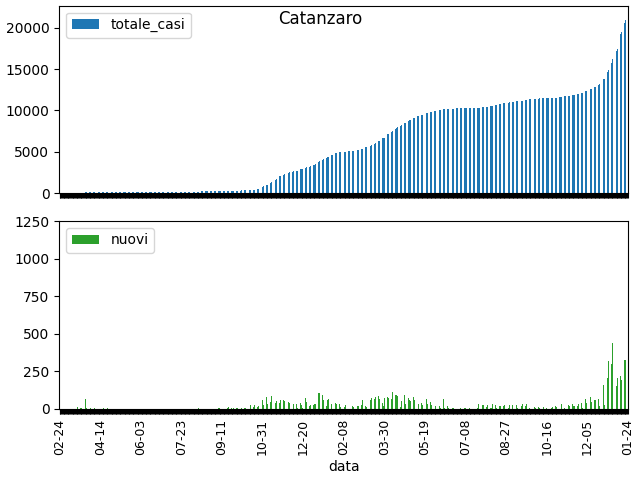
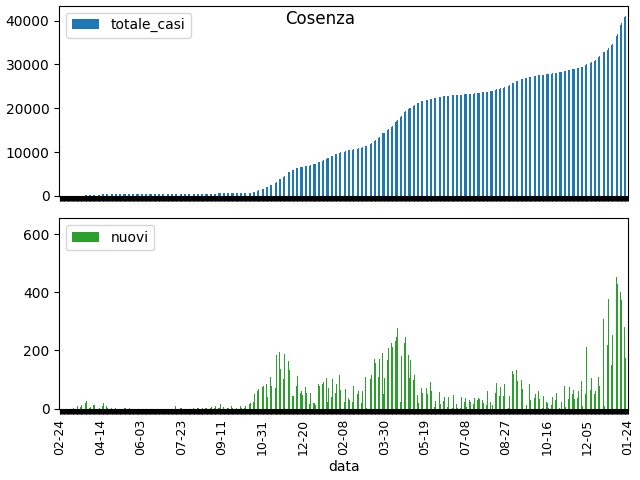
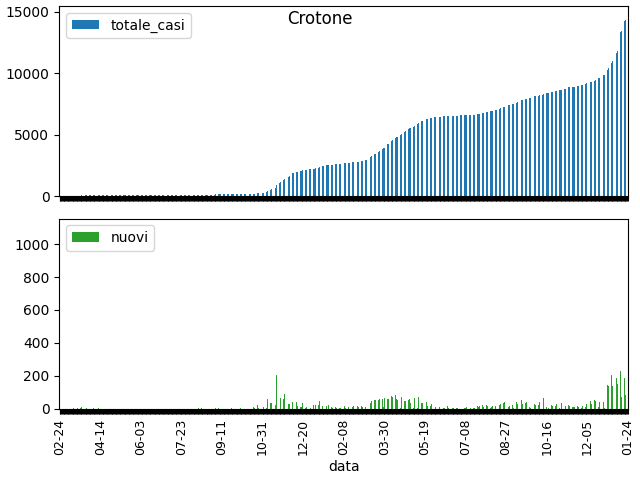
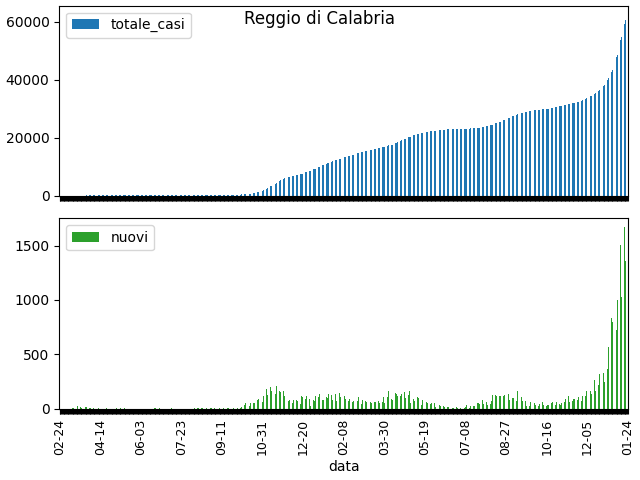
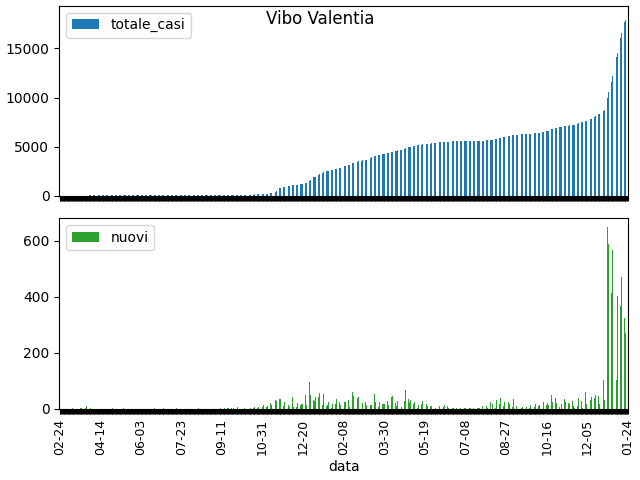
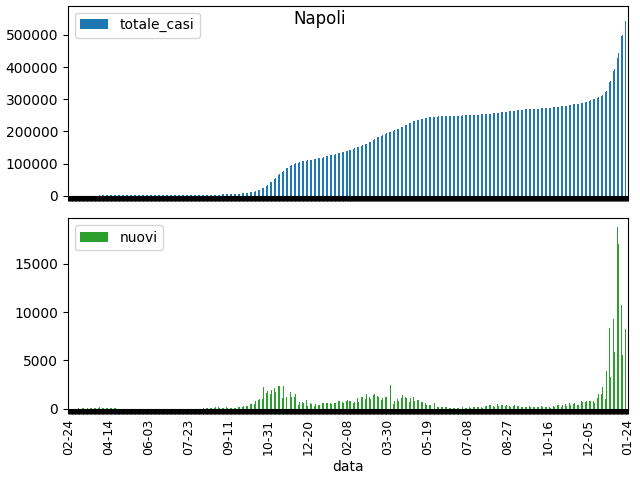
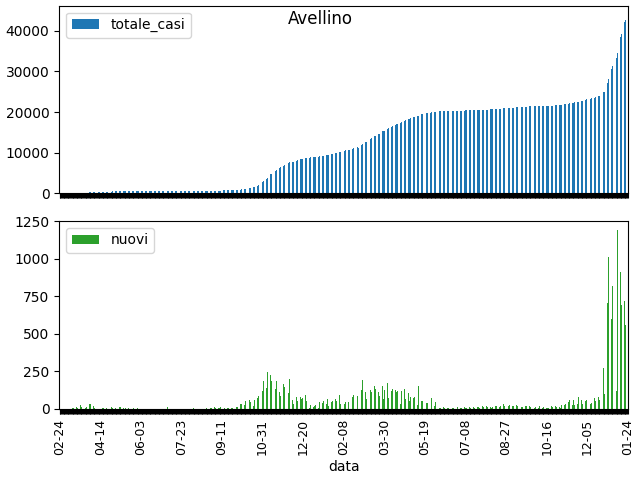
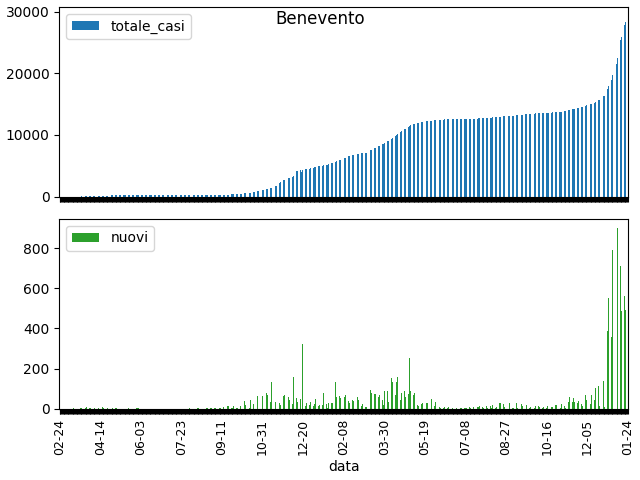
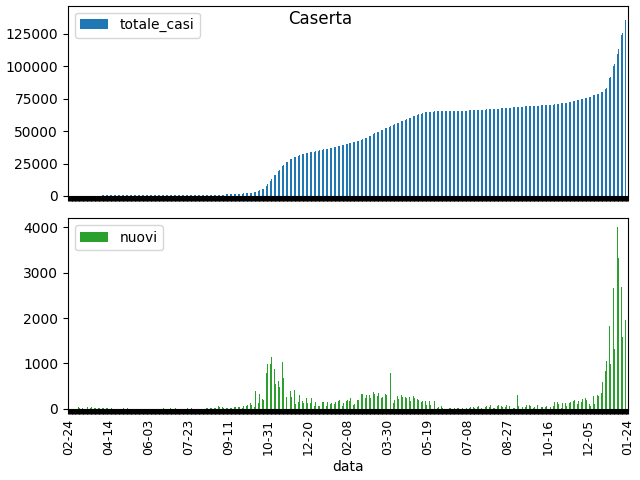
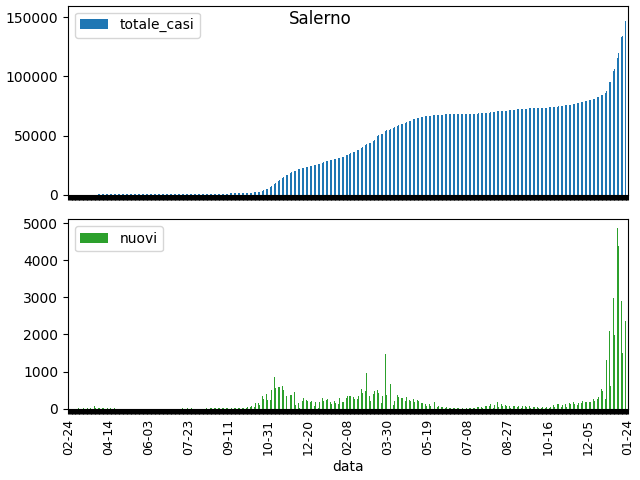
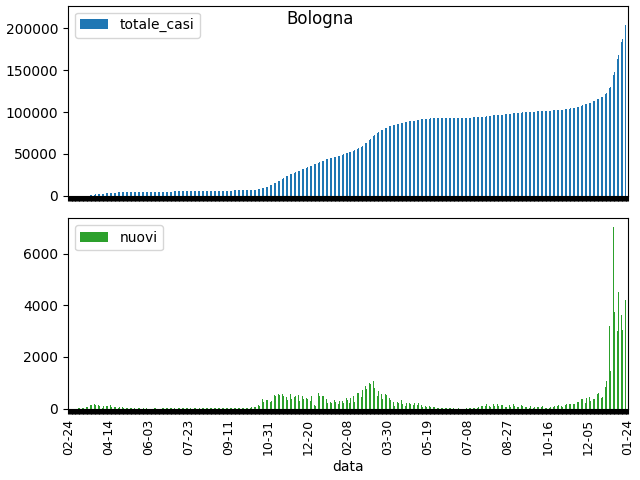
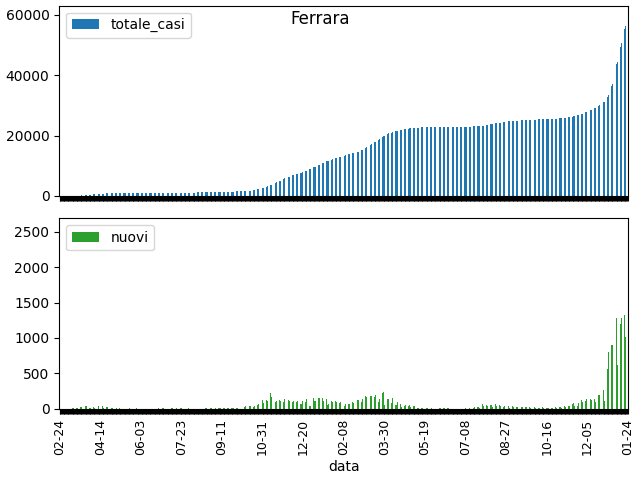
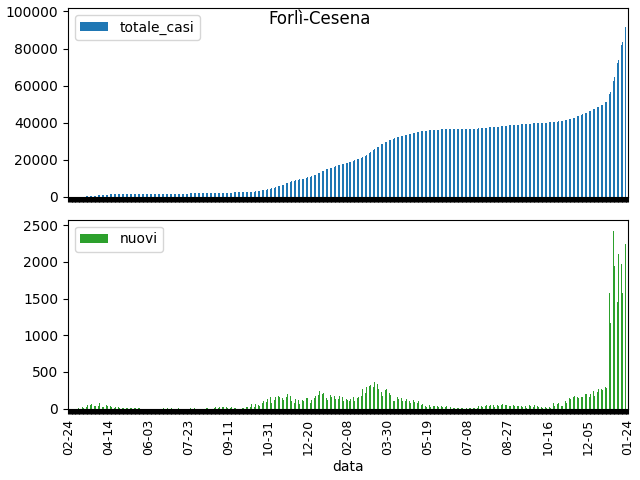
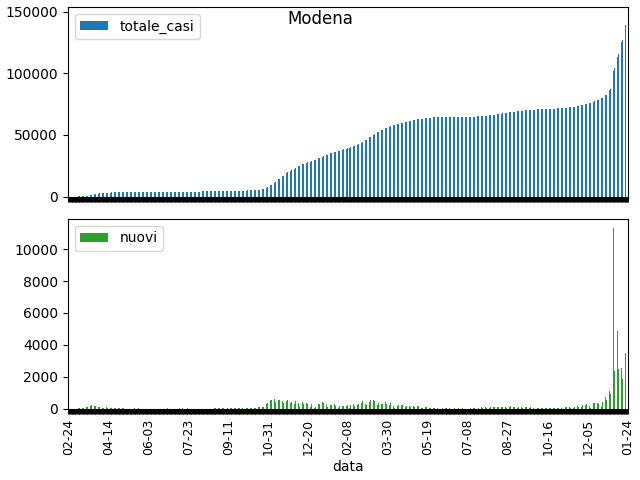
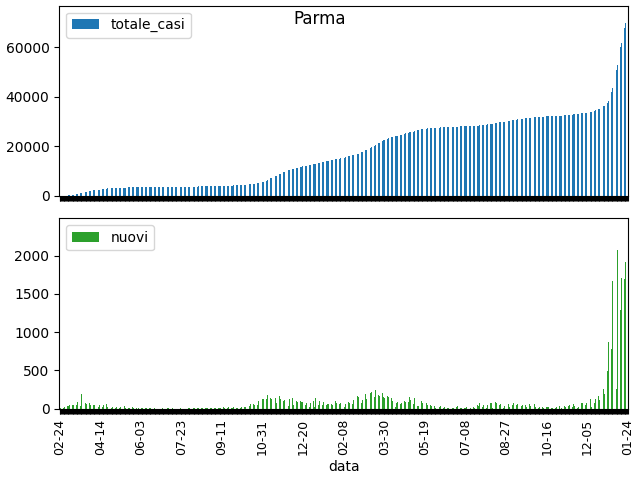
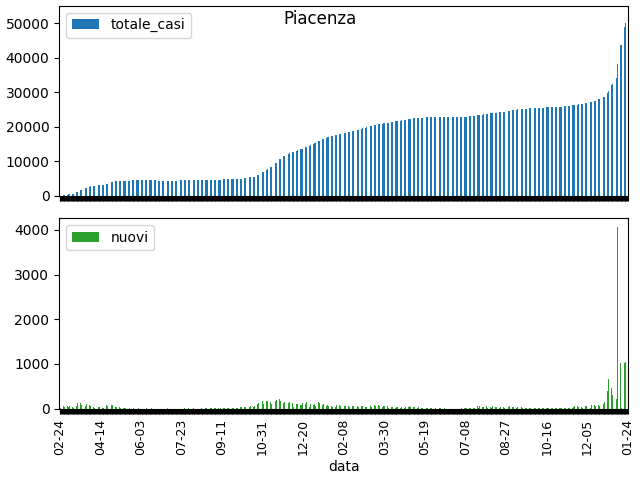
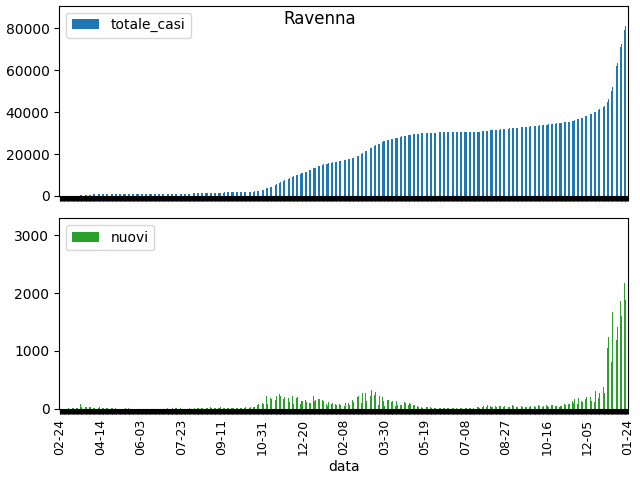
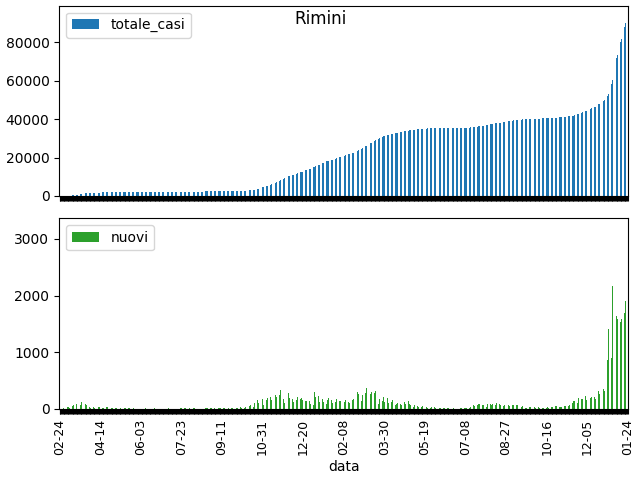
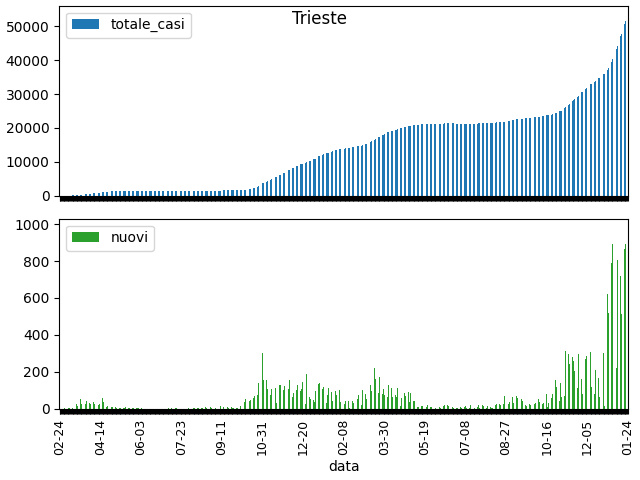
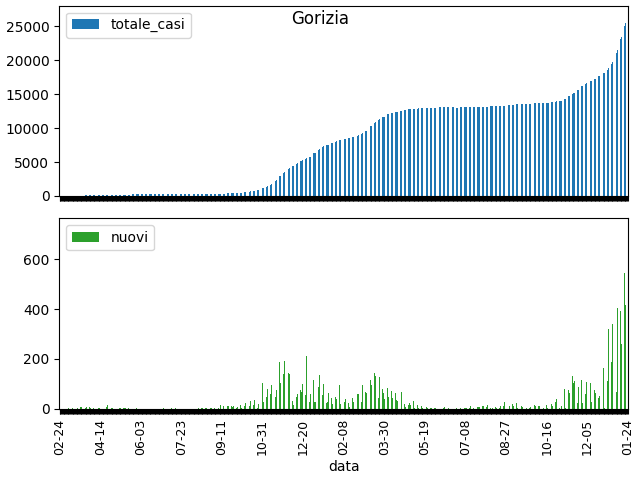
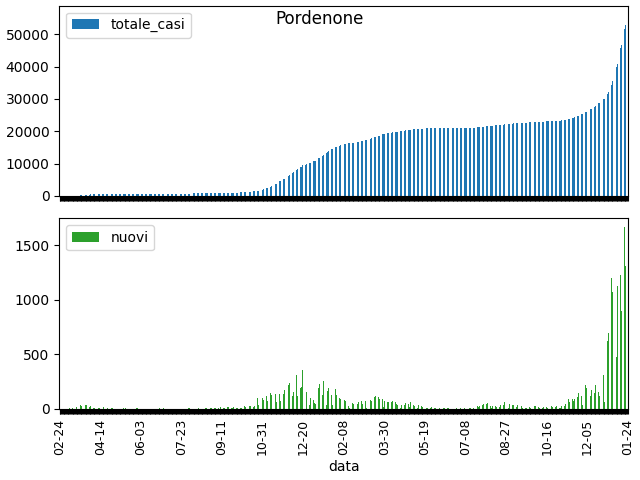
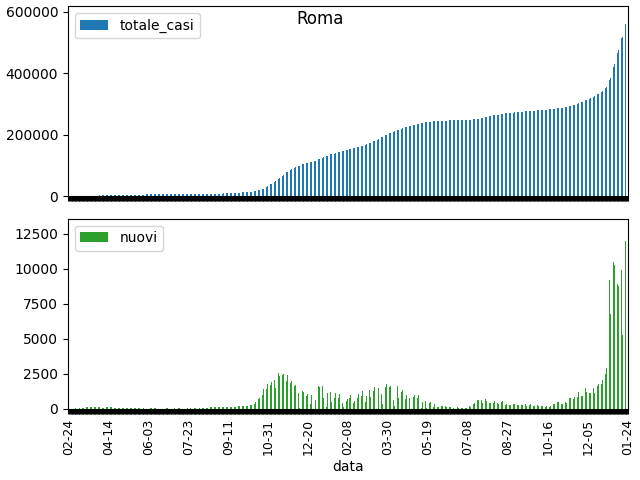
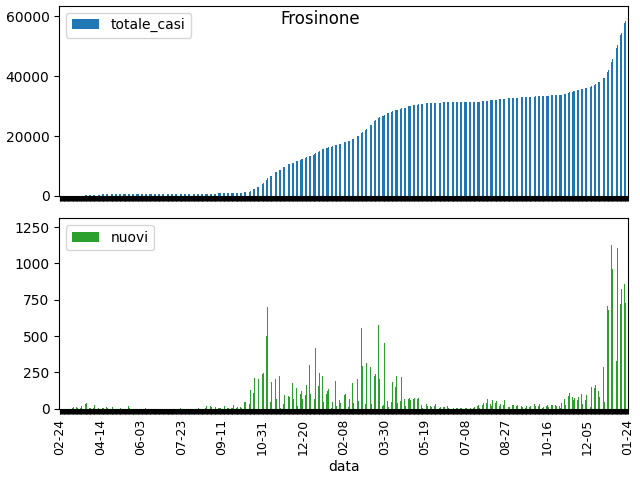
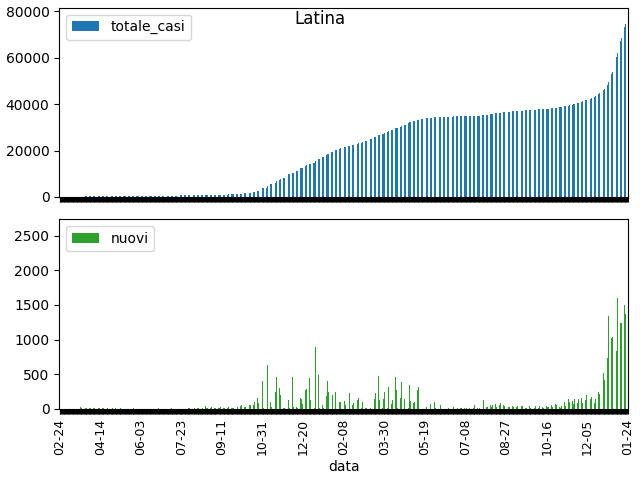
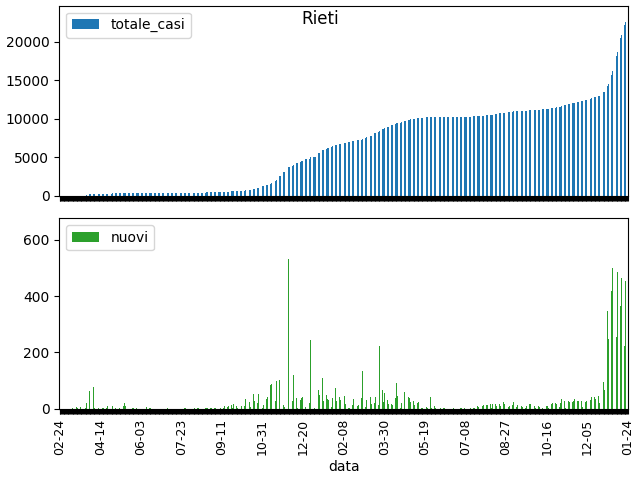
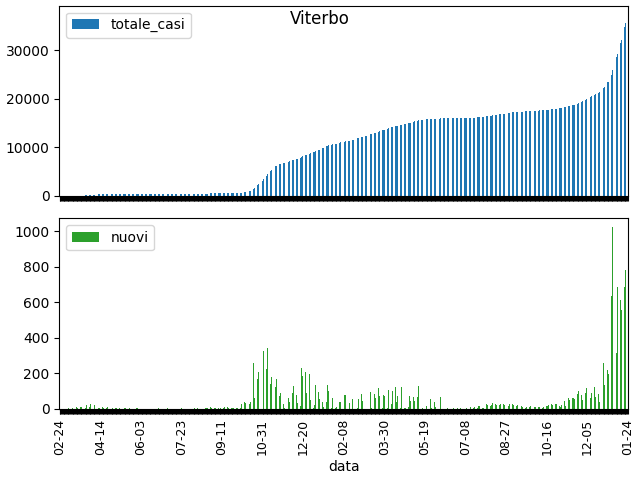
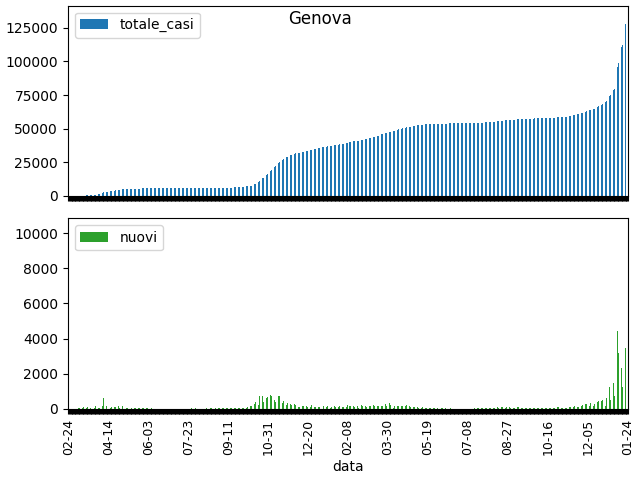
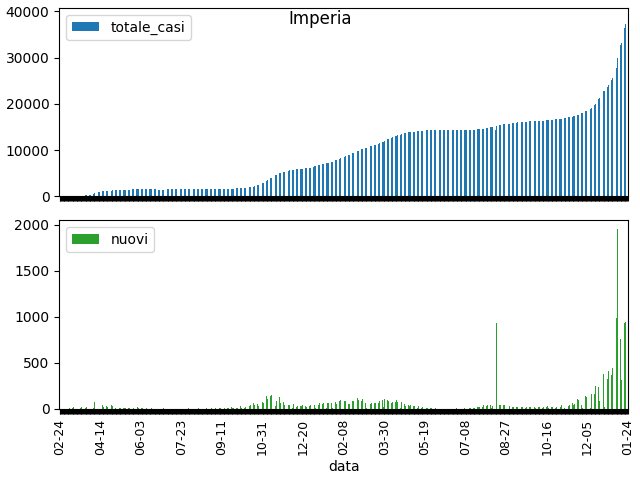
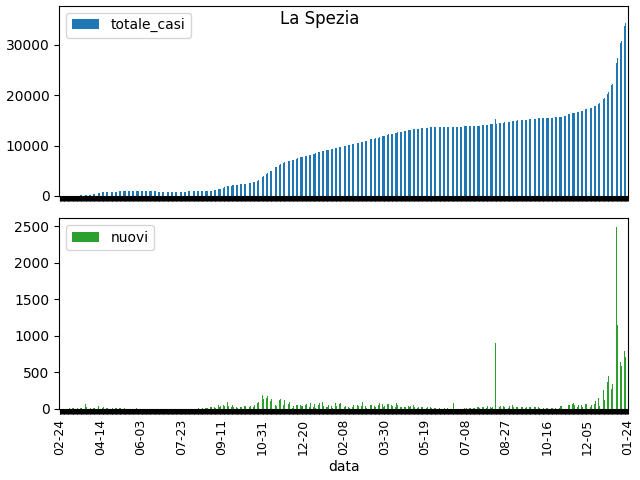
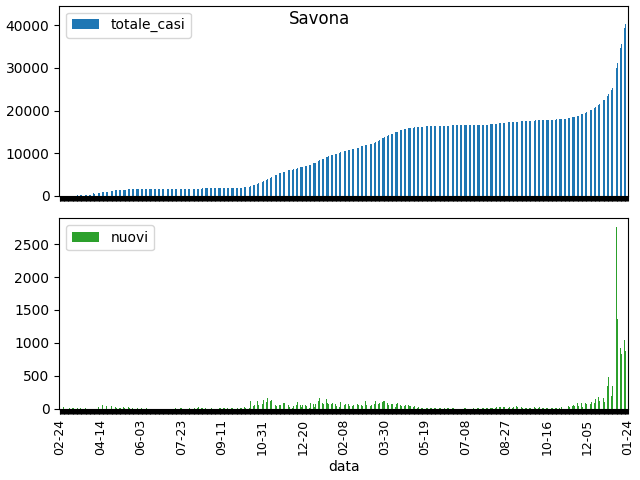
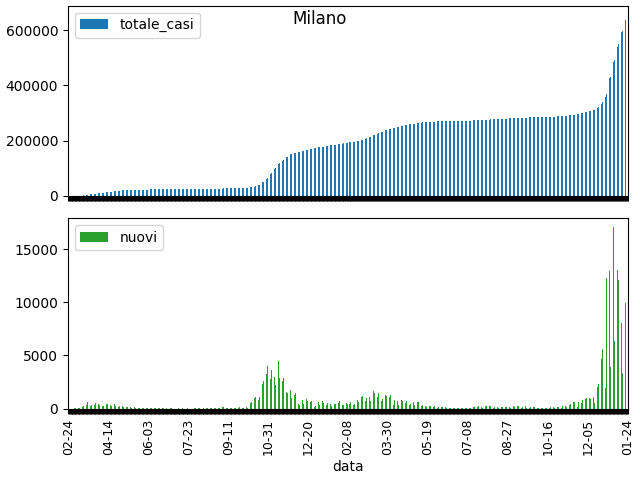
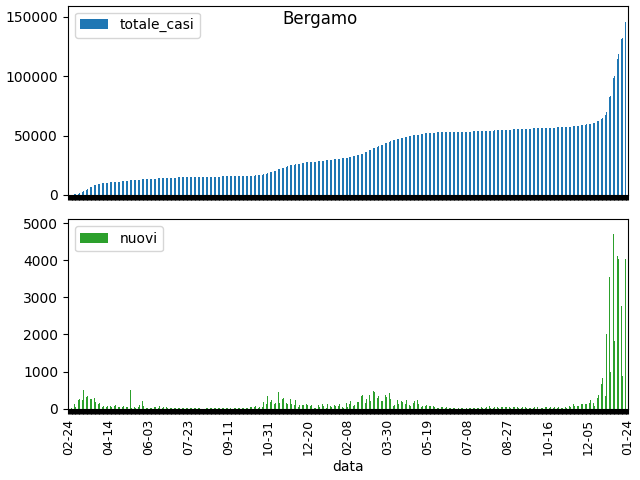
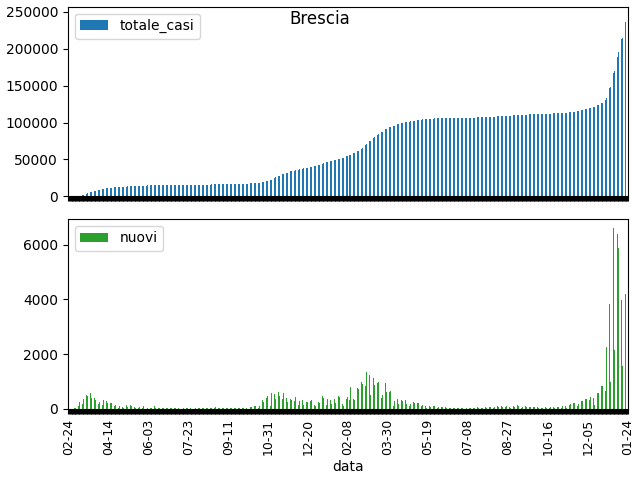
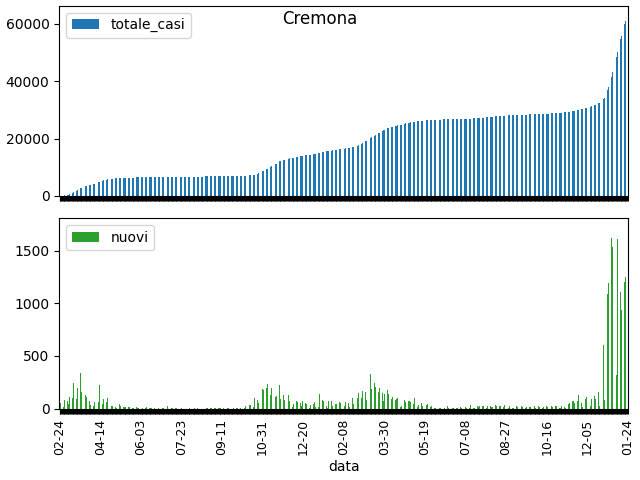
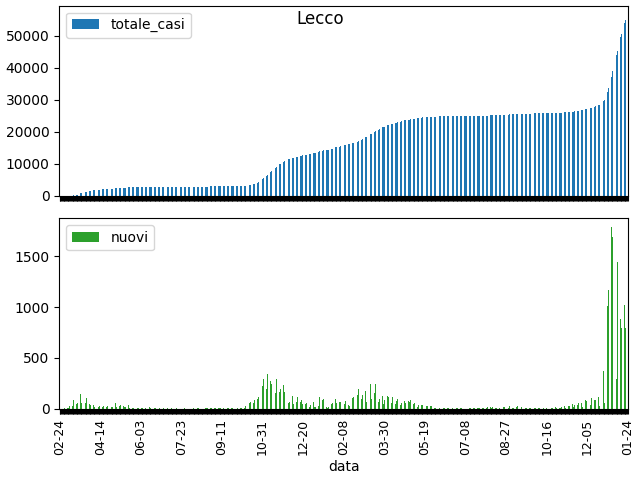
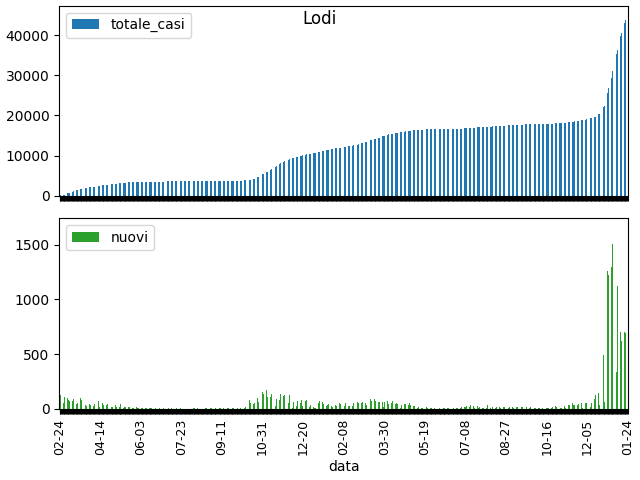
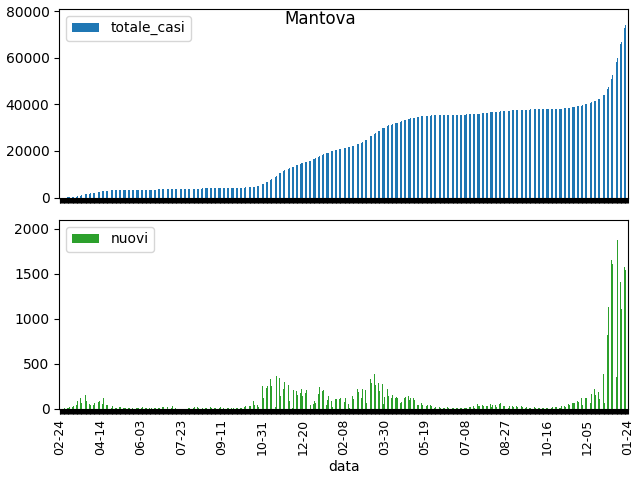
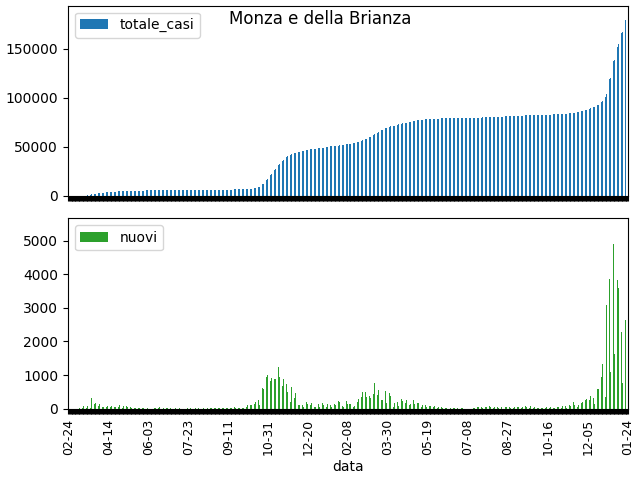
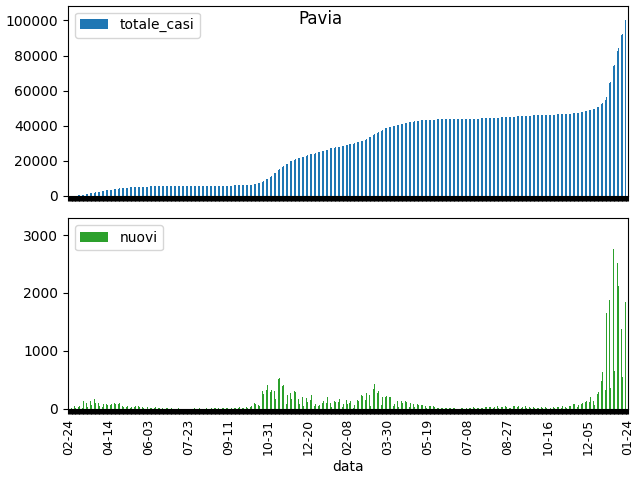
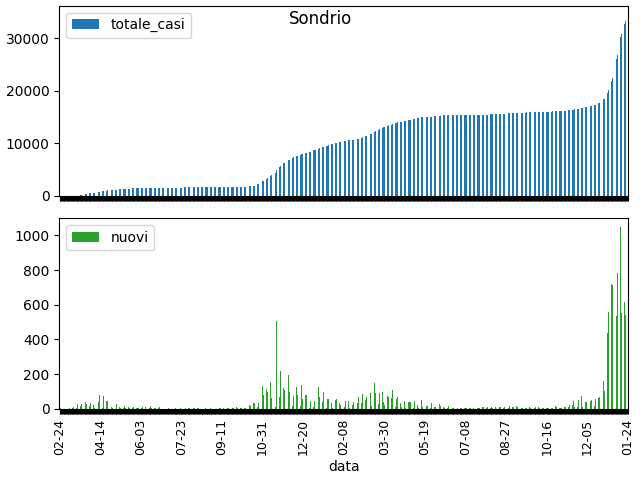
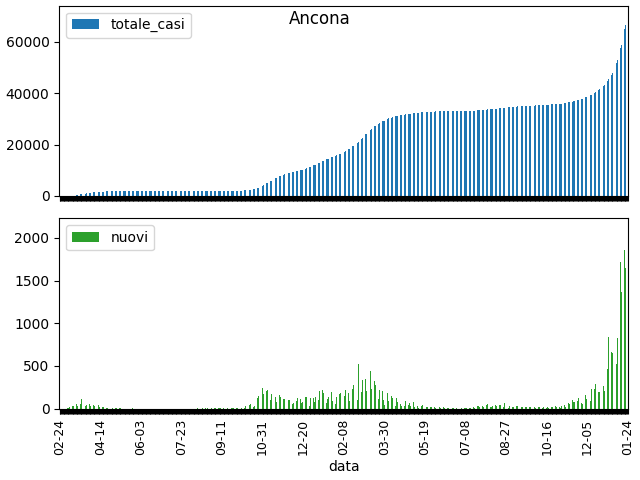
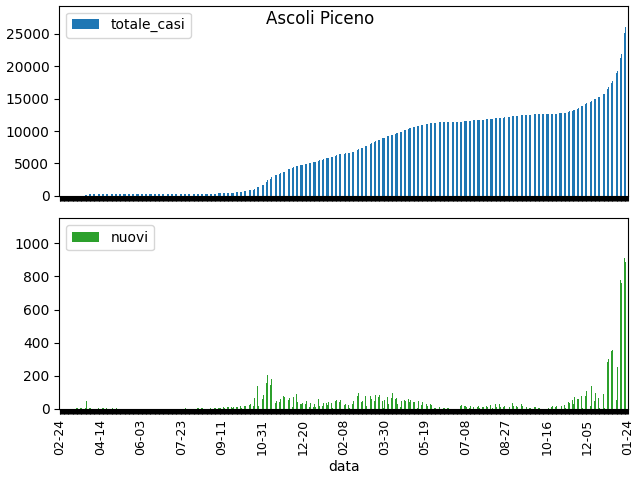
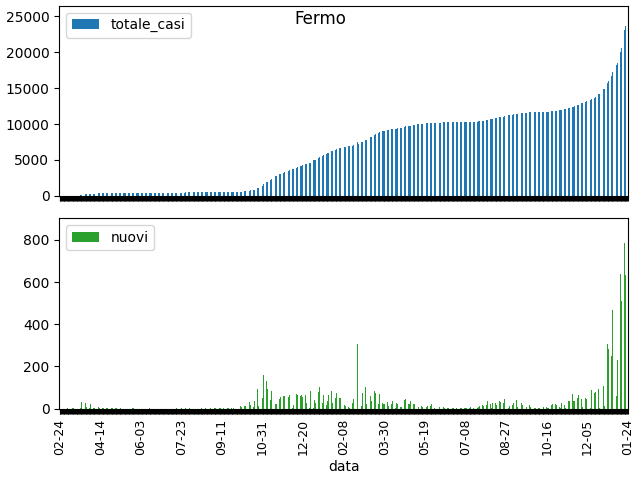
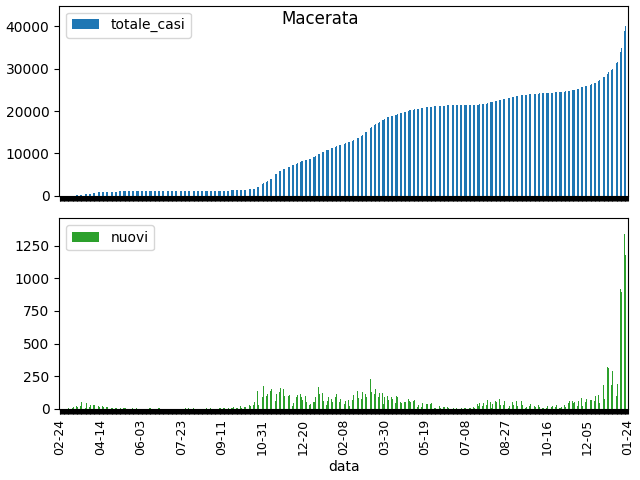
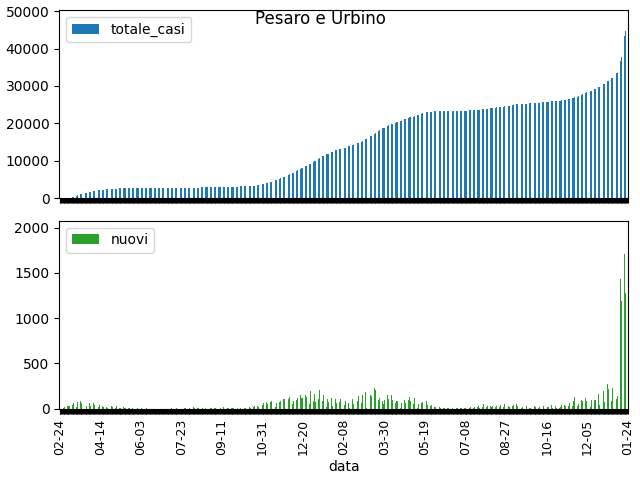
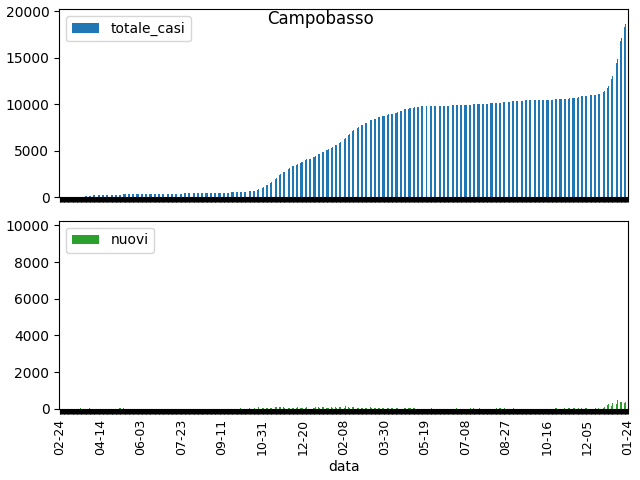
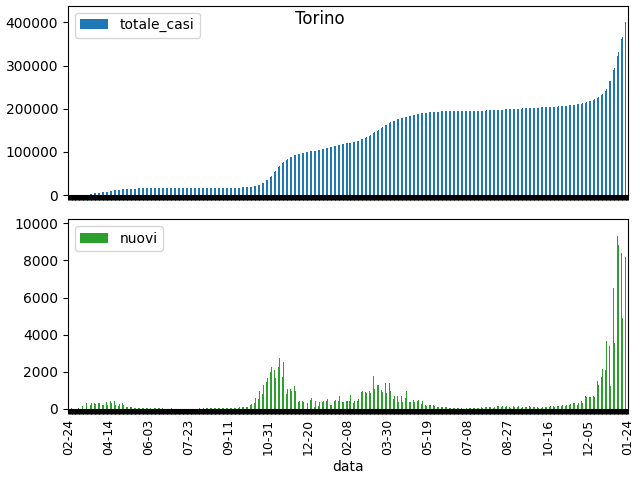
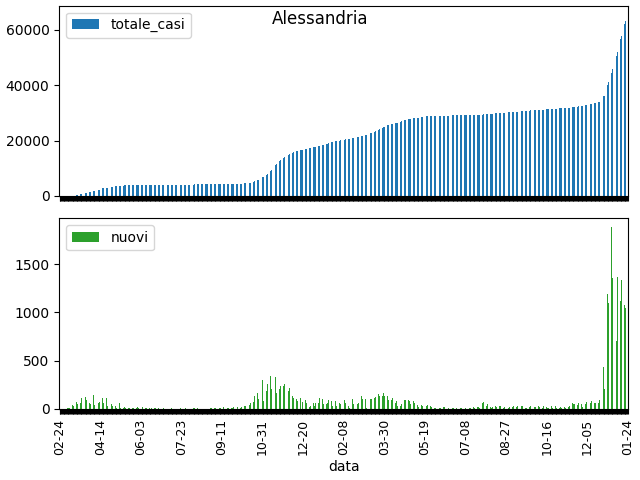
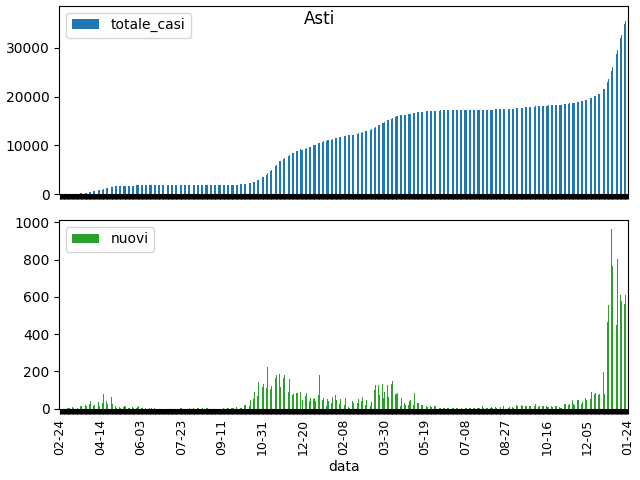
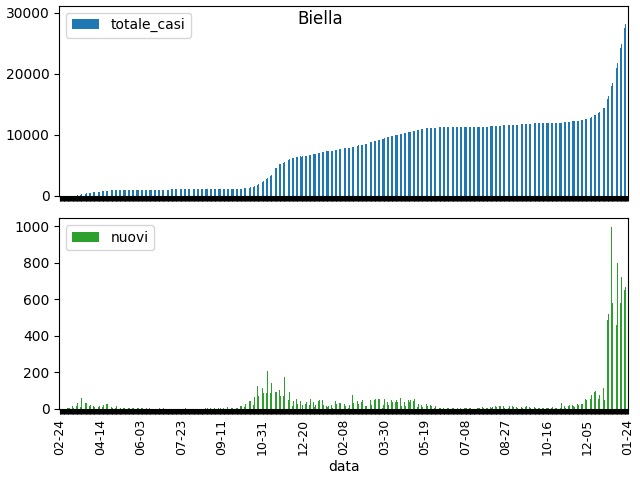
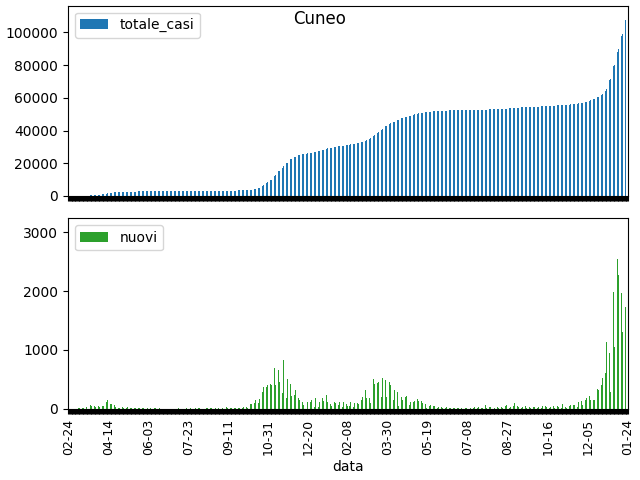
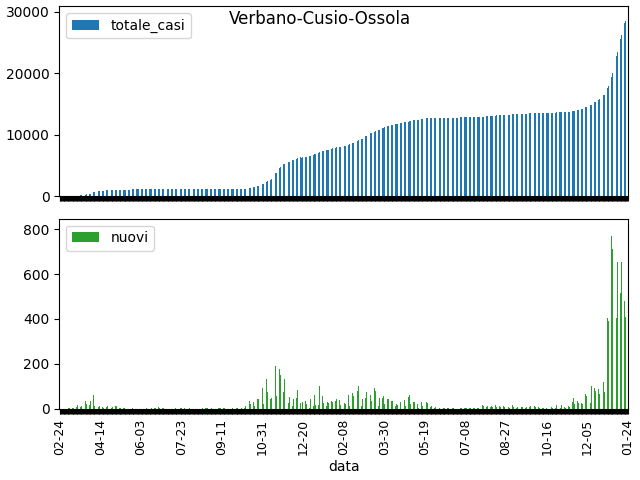
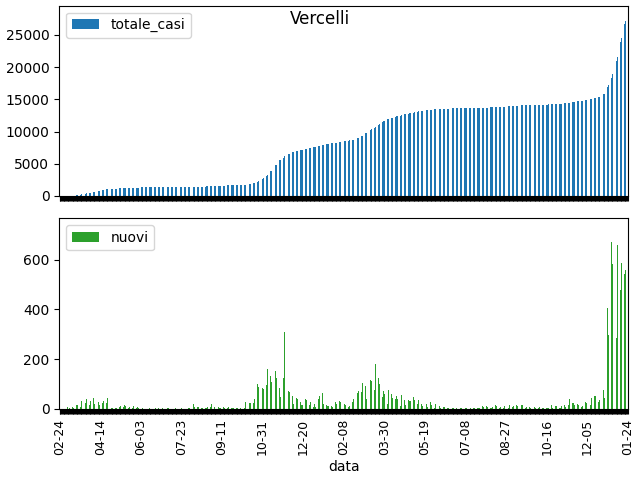
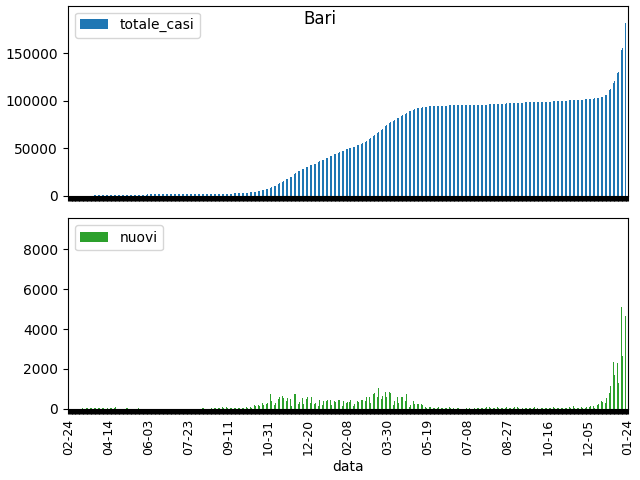
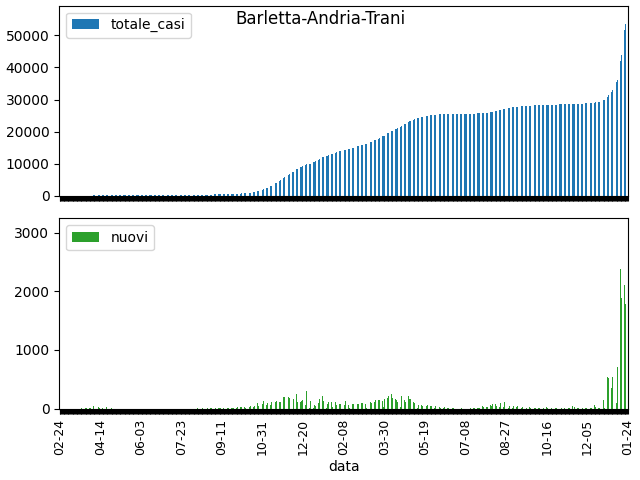
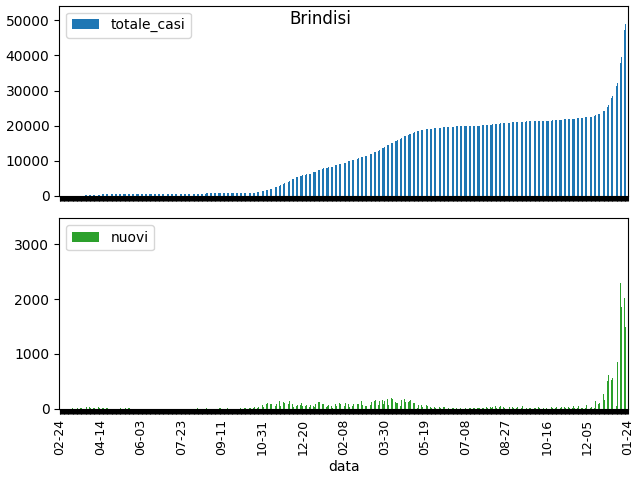
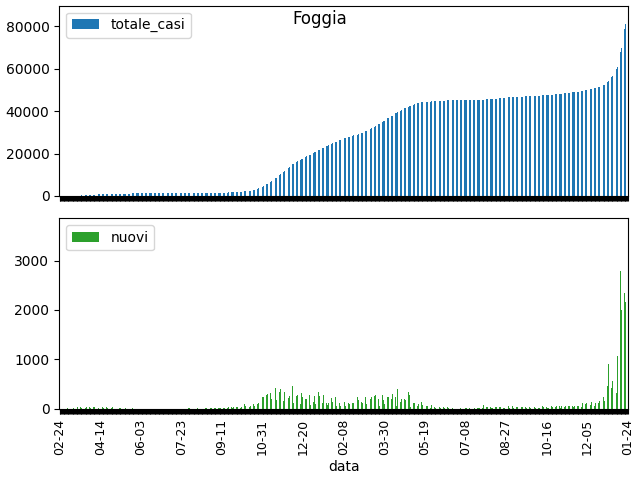
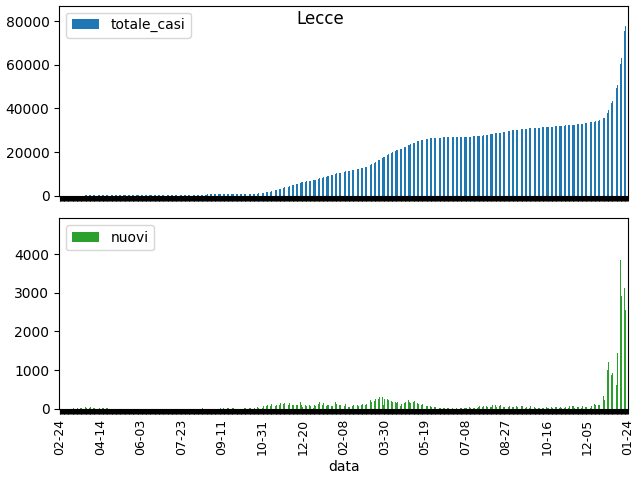
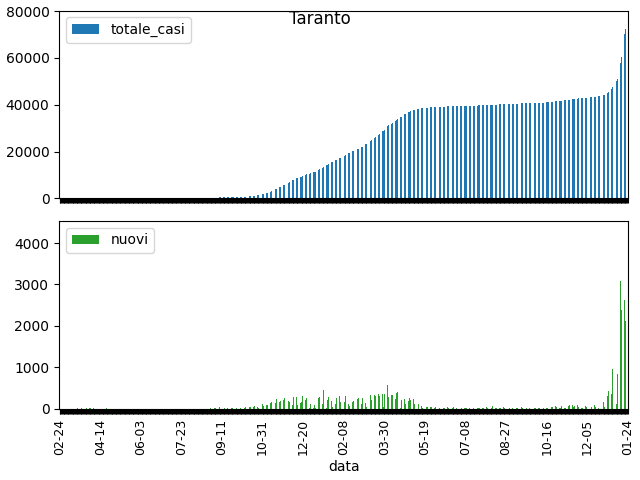
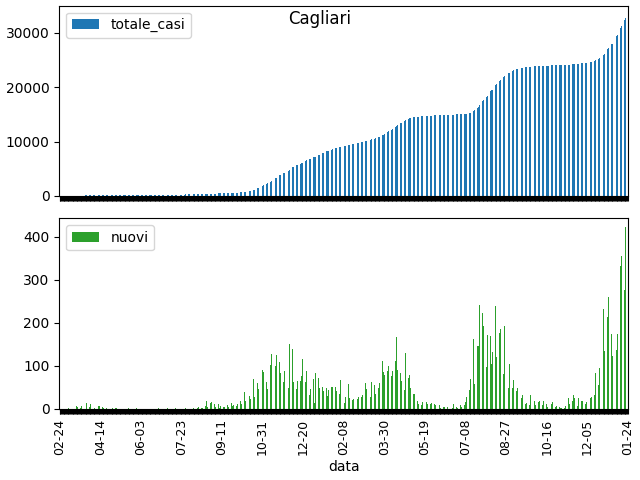
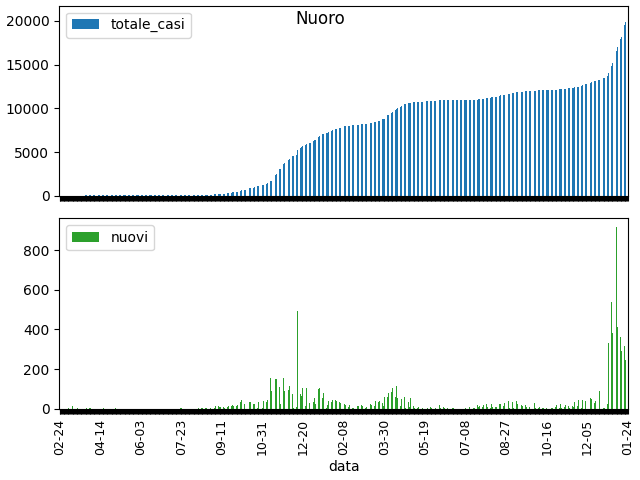
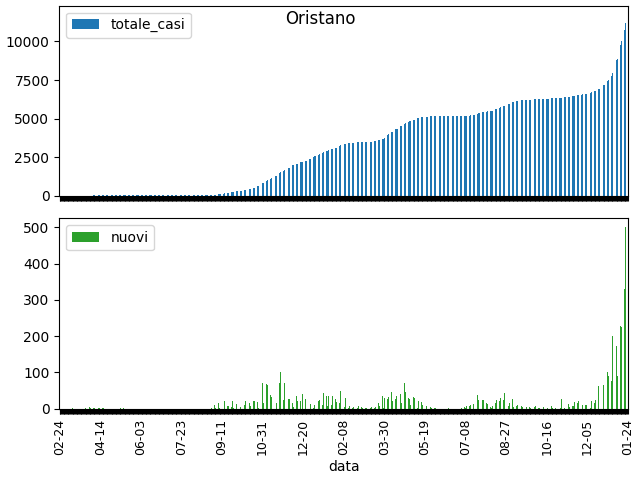
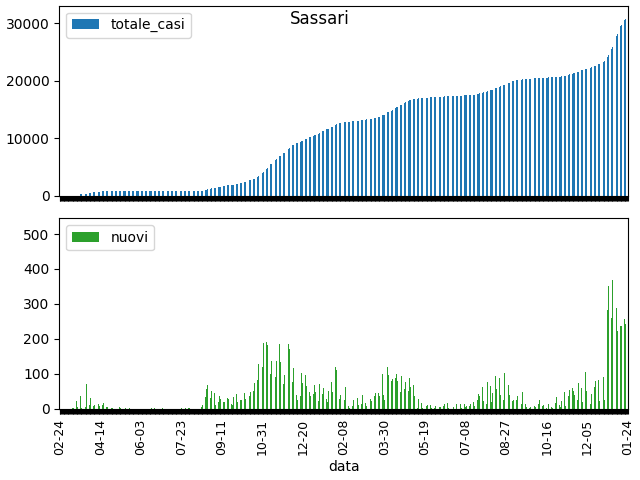
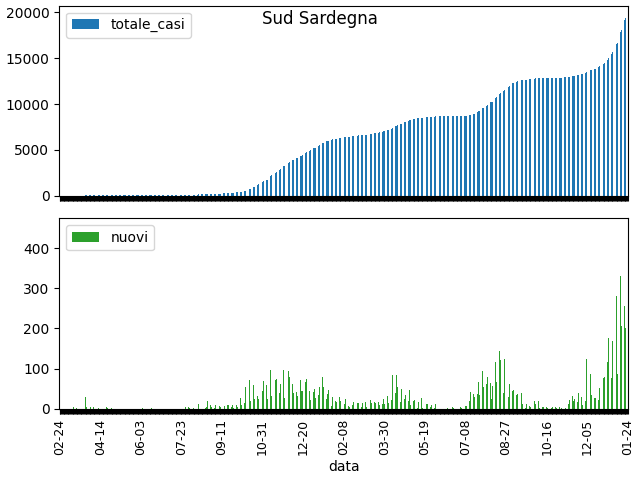
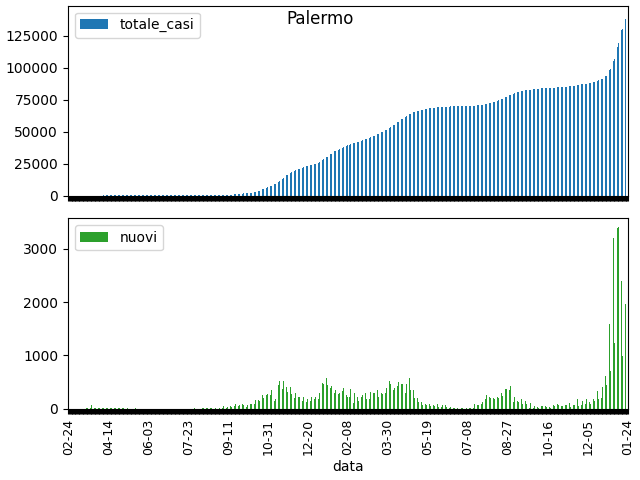
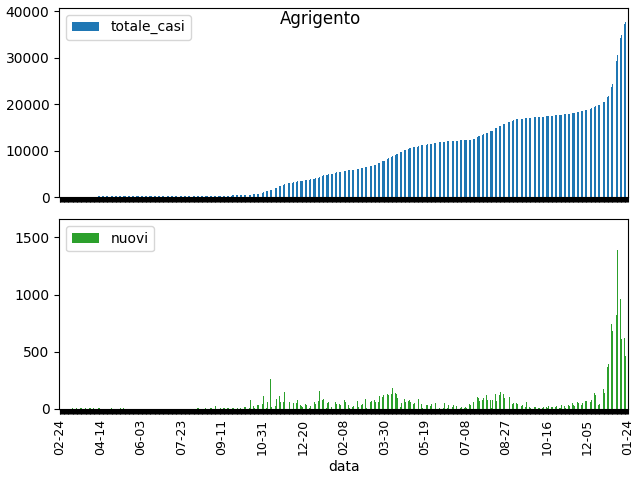
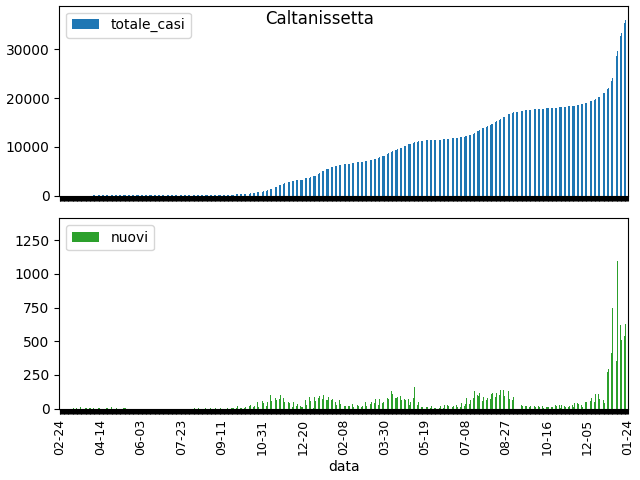
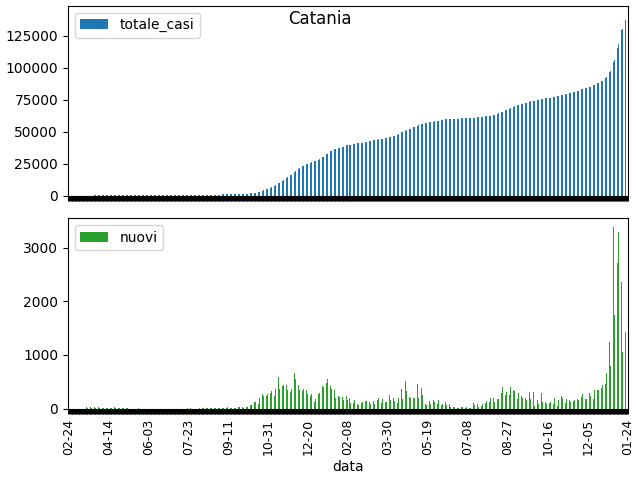
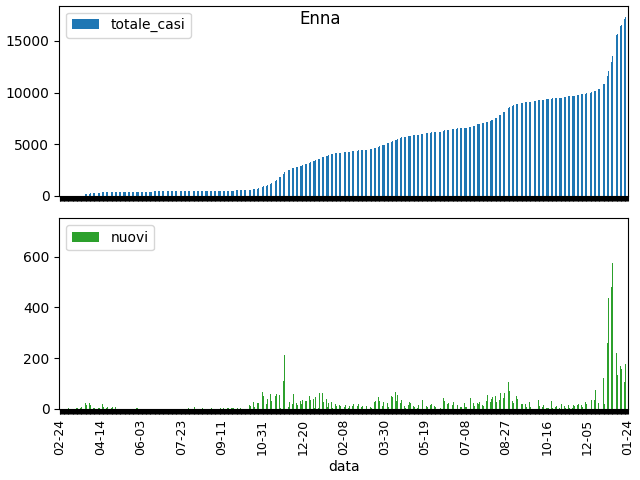
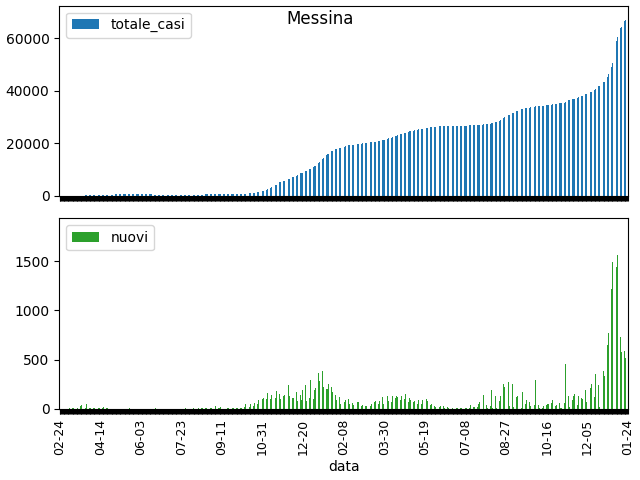
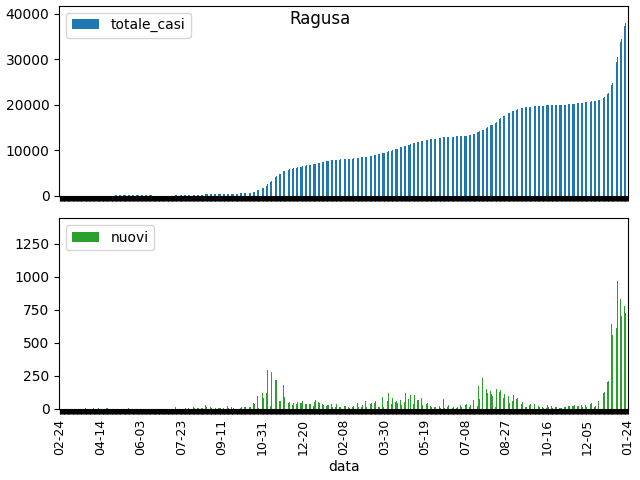
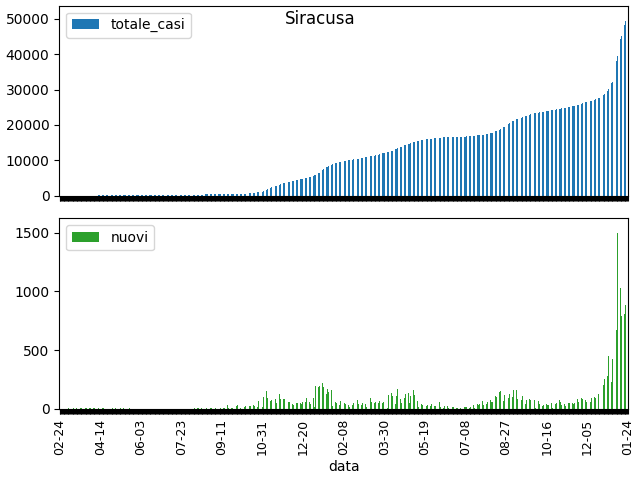
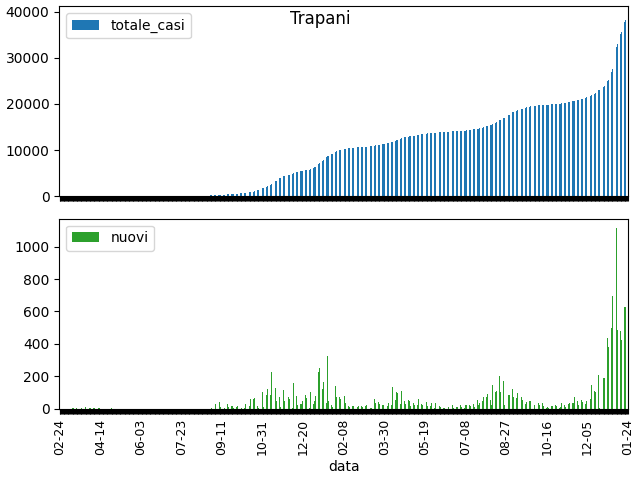
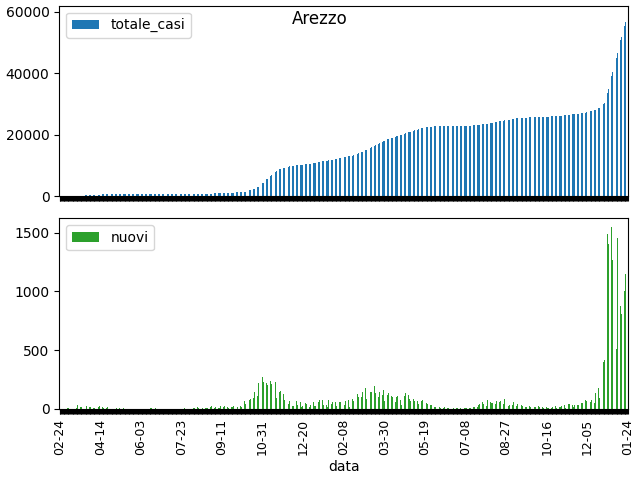
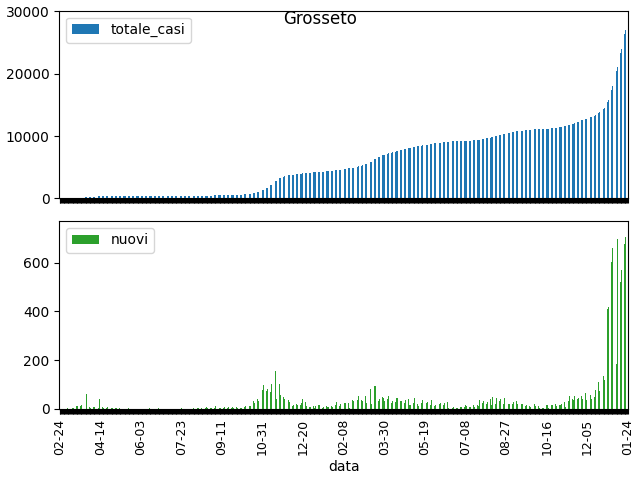
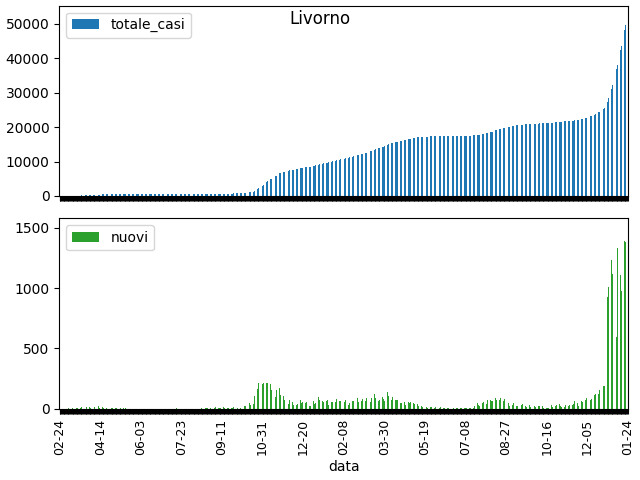
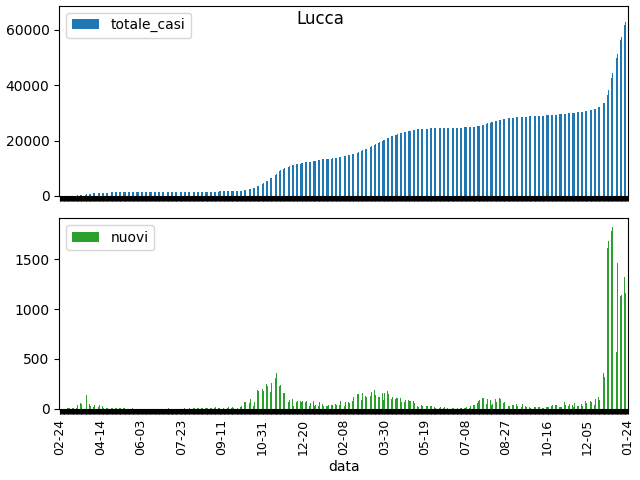
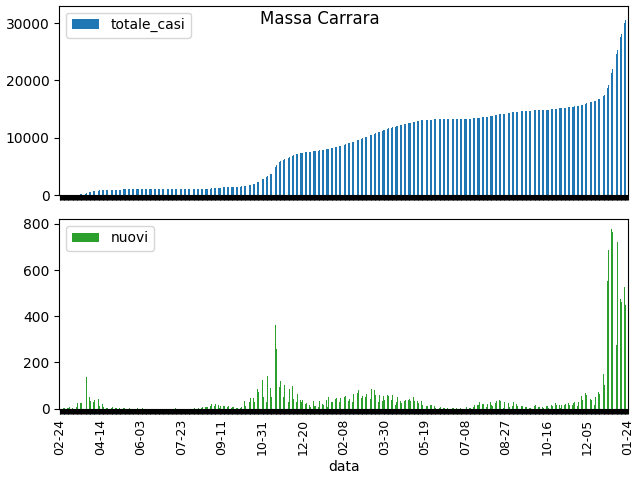
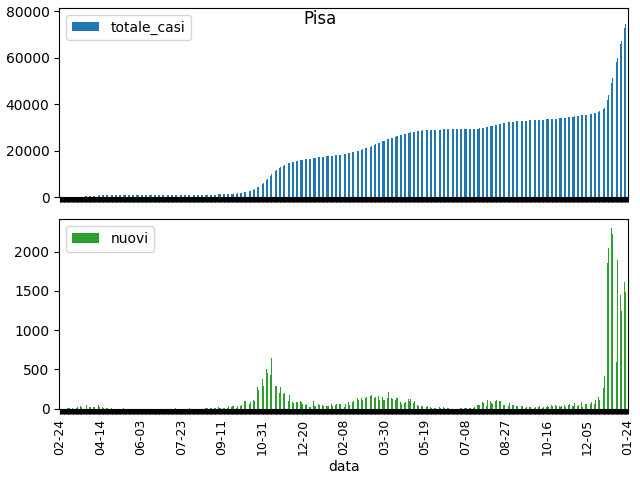
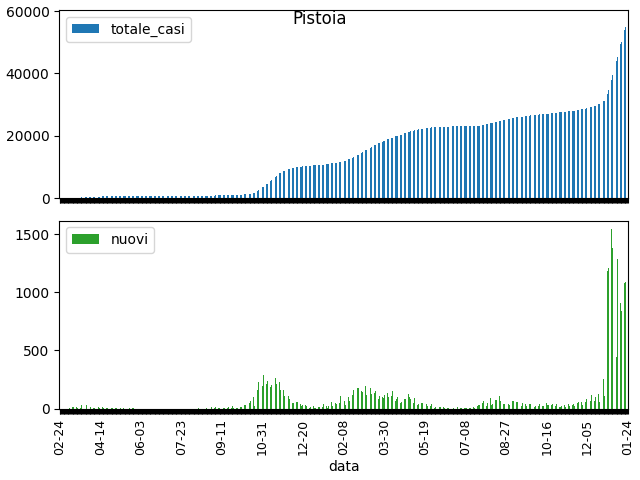
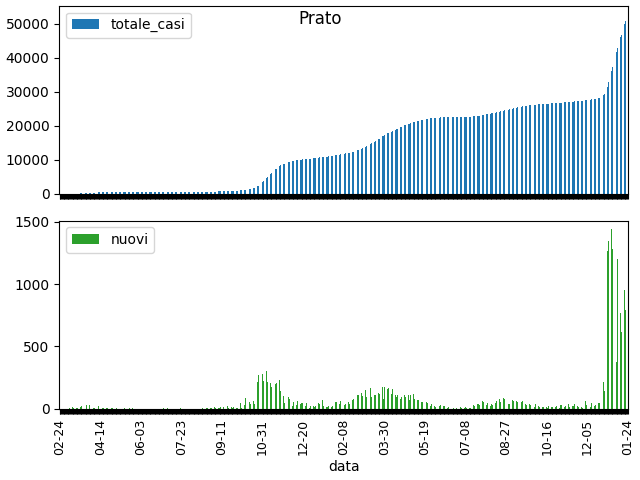
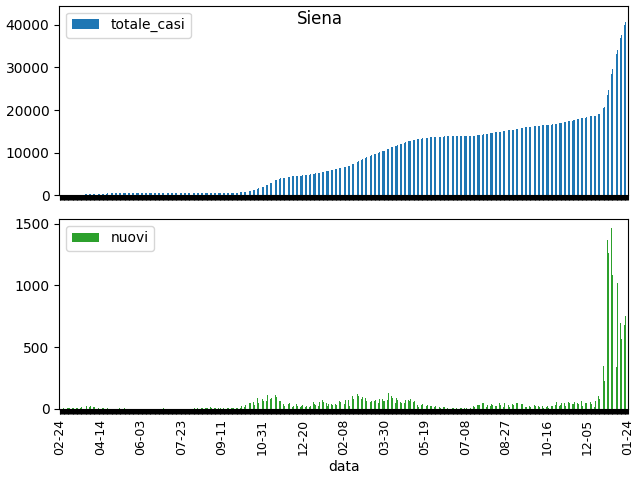
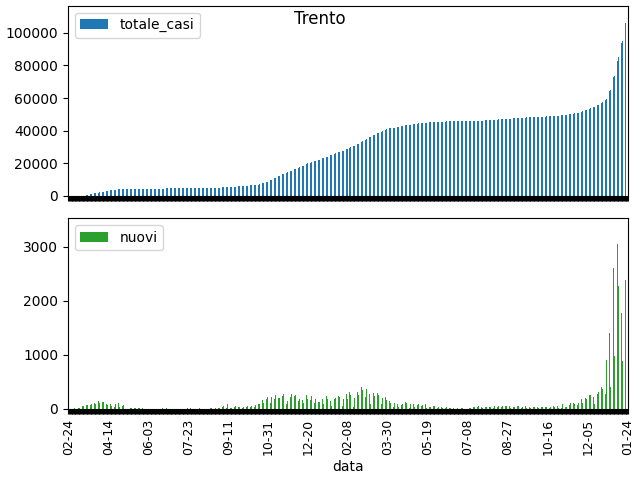
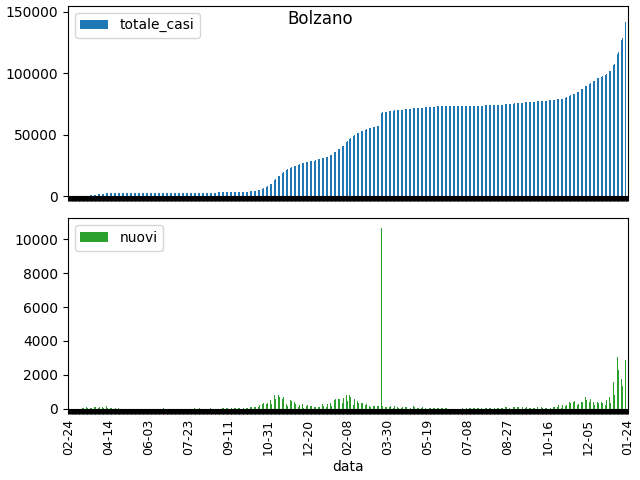
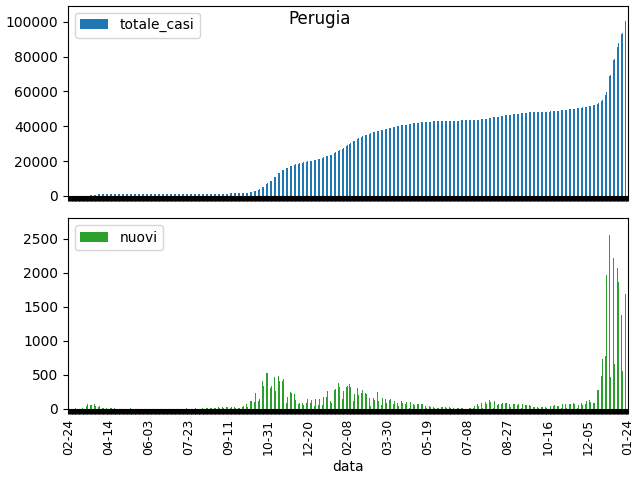
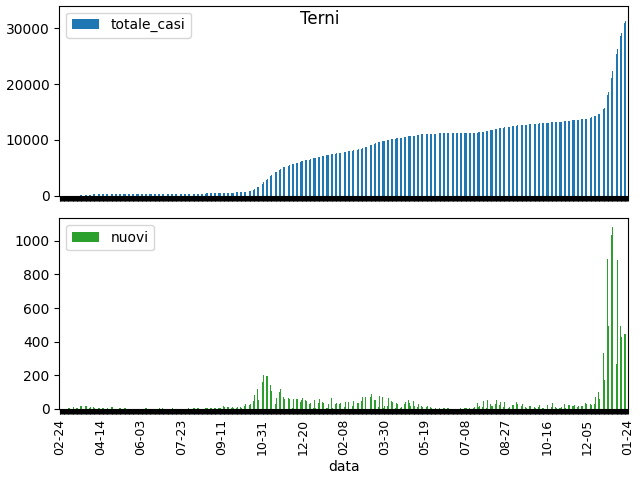
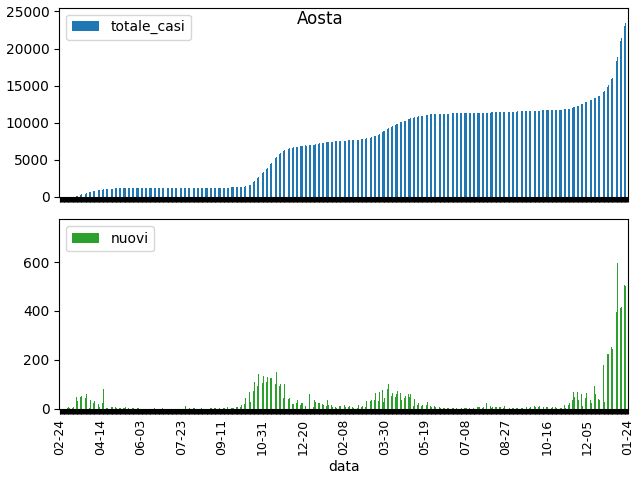
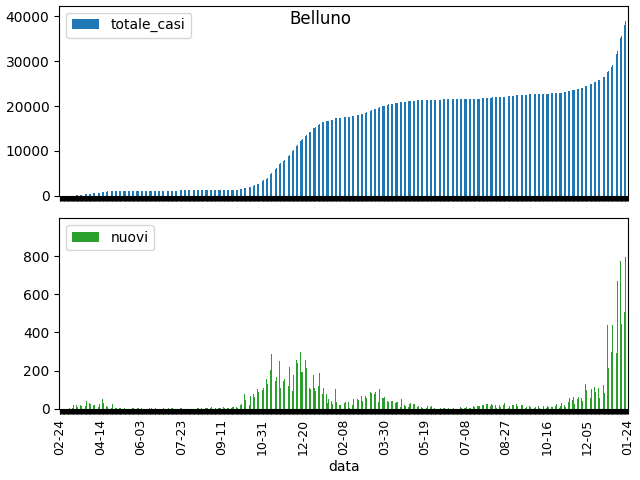
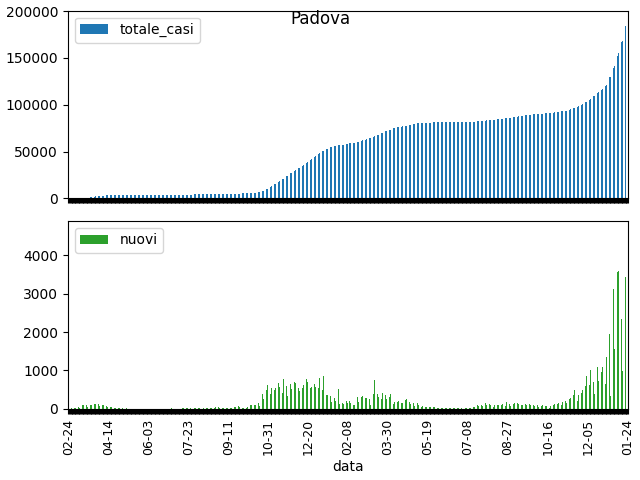
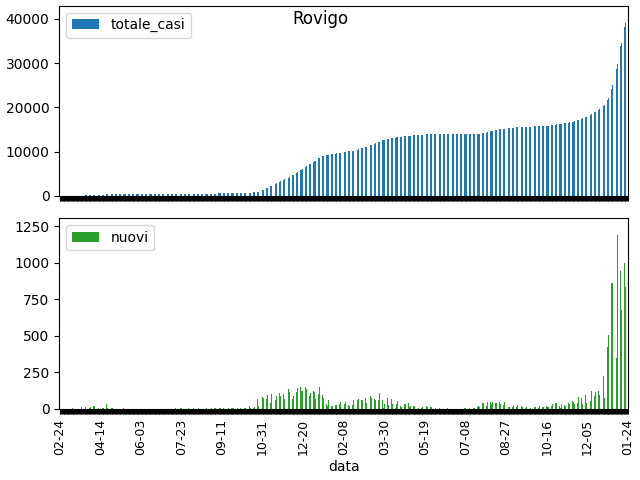
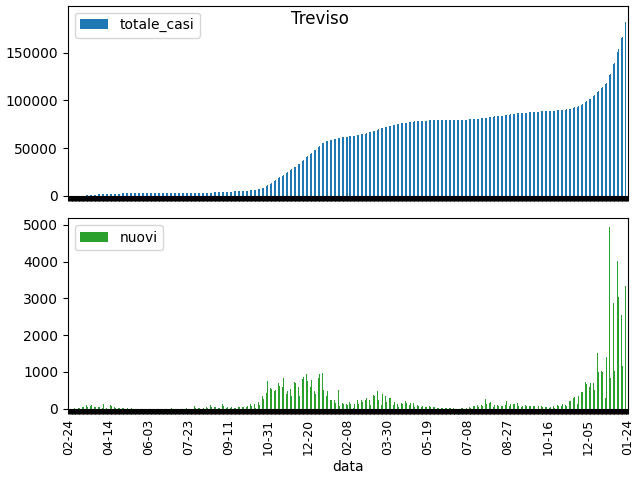
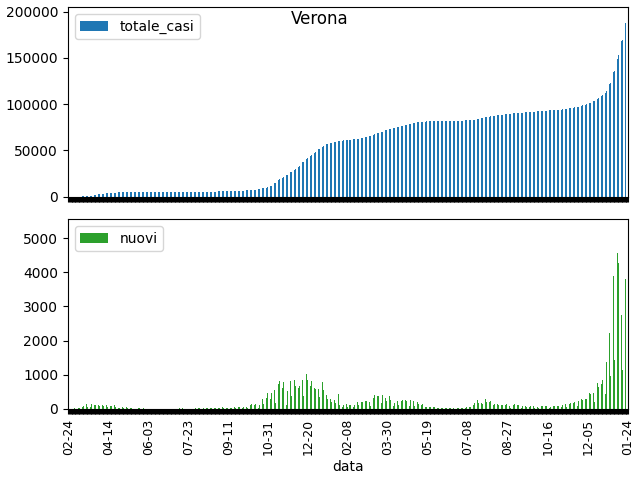
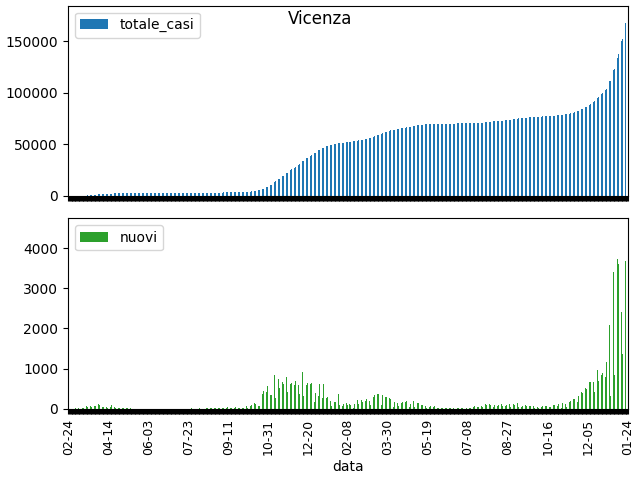
The rest of plots represent each of the provinces in the region. The capital appears first, in italics (e.g., L’Aquila ). Again, at the bottom the new cases per day are displayed, whereas on top only the accumulated total of cases is shown (the other two numbers are not available in the data sources).
Here is an index to the different regions. Just click on the region you are interested in.
Region
Capital province
Rest of provinces
Abruzzo
L’Aquila
Chieti, Pescara, Teramo
Basilicata
Potenza
Matera
Calabria
Catanzaro
Cosenza, Crotone, Reggio Calabria, Vibo Valentia
Campania
Napoli
Avellino, Benevento, Caserta, Salerno
Emilia-Romagna
Bologna
Ferrara, Forlì-Cesena, Modena, Parma, Piacenza, Ravenna, Reggio Emilia, Rimini
Friuli-Venezia Giulia
Trieste
Gorizia, Pordenone
Lazio
Roma
Frosinone, Latina, Rieti, Viterbo
Liguria
Genova
Imperia, La Spezia, Savona
Lombardia
Milano
Bergamo, Brescia, Como, Cremona, Lecco, Lodi, Mantova, Monza e Brianza, Pavia, Sondrio, Varese
Marche
Ancona
Ascoli Piceno, Fermo, Macerata, Pesaro e Urbino
Molise
Campobasso
Isernia
Piemonte
Torino
Alessandria, Asti, Biella, Cuneo, Novara, Verbano-Cusio-Ossola, Vercelli
Puglia
Bari
Barletta-Andria-Trani, Brindisi, Foggia, Lecce, Taranto
Sardegna
Cagliari
Nuoro, Oristano, Sassari, Sud Sardegna
Sicilia
Palermo
Agrigento, Caltanissetta, Catania, Enna, Messina, Ragusa, Siracusa, Trapani
Toscana
Firenze
Arezzo, Grosseto, Livorno, Lucca, Massa e Carrara, Pisa, Pistoia, Prato, Siena
Trentino-Alto Adige
Trento
Bolzano
Umbria
Perugia
Terni
Valle d’Aosta
Aosta
Veneto
Venezia
Belluno, Padova, Rovigo, Treviso, Verona, Vicenza
Abruzzo
L’Aquila
Chieti
Pescara
Teramo
go up
Basilicata
Potenza
Matera
go up
Calabria
Catanzaro
Cosenza
Crotone
Reggio di Calabria
Vibo Valentia
go up
Campania
Napoli
Avellino
Benevento
Caserta
Salerno
go up
Emilia-Romagna
Bologna
Ferrara
Forlì-Cesena
Modena
Parma
Piacenza
Ravenna
Reggio nell’Emilia
Rimini
go up
Friuli-Venezia Giulia
Trieste
Gorizia
Pordenone
go up
Lazio
Roma
Frosinone
Latina
Rieti
Viterbo
go up
Liguria
Genova
Imperia
La Spezia
Savona
go up
Lombardia
Milano
Bergamo
Brescia
Como
Cremona
Lecco
Lodi
Mantova
Monza e della Brianza
Pavia
Sondrio
Varese
go up
Marche
Ancona
Ascoli Piceno
Fermo
Macerata
Pesaro e Urbino
go up
Molise
Campobasso
Isernia
go up
Piemonte
Torino
Alessandria
Asti
Biella
Cuneo
Novara
Verbano-Cusio-Ossola
Vercelli
go up
Puglia
Bari
Barletta-Andria-Trani
Brindisi
Foggia
Lecce
Taranto
go up
Sardegna
Cagliari
Nuoro
Oristano
Sassari
Sud Sardegna
go up
Sicilia
Palermo
Agrigento
Caltanissetta
Catania
Enna
Messina
Ragusa
Siracusa
Trapani
go up
Toscana
Firenze
Arezzo
Grosseto
Livorno
Lucca
Massa Carrara
Pisa
Pistoia
Prato
Siena
go up
P.A. Bolzano
P.A.Trento
Trento
Bolzano
go up
go up
Valle d’Aosta
Aosta
go up
Veneto
Venezia
Belluno
Padova
Rovigo
Treviso
Verona
Vicenza
go up
In some cases the number of new cases might be negative. The
reasons
are (in general) wrong reporting in a specific day. They are simply clipped to 0.
Other plots are published
here
There are other nice visualisations, such as these
dynamic maps
The data comes from
Dipartimento della Protezione Civile